Accelerating Dashboards with Reflections
This tutorial guides you through accelerating updates to a dashboard by creating a Reflection. Reflections organize and optimize the data close to Dremio Sonar’s query engine, using techniques such as pre-computation, columnarization, compression, sorting, partitioning, and data aggregation.
In this tutorial, you will:
- Modify a dashboard in Tableau. You will note the amount of time it takes for the dashboard to be updated, establishing a baseline against which to measure the time updates take after they are accelerated by a Reflection.
- Create an aggregation Reflection.
- Modify the dashboard again to see how much faster it is updated and view the jobs that updated the dashboard.
Prerequisites
-
Ensure that you are using Tableau.
-
Download the workbook that includes the dashboard that you will use in this tutorial. This dashboard is built on the
Samples.”samples.dremio.com”.NYC-taxi-trips-icebergdataset that is in an Amazon S3 bucket in Apache Iceberg table format (330+ million rows). -
Before you begin, sign up for Dremio Cloud and create your first project. When you're done signing up, you are logged in to your organization and can start the tutorial by adding your first Sonar project.
-
Sign up for Dremio Cloud and verify that you meet the prerequisites for configuring a Sonar project. When you're done signing up, you are logged in to your organization and can start the tutorial by adding your first Sonar project.
Step 1. Modify the Dashboard in Tableau
Before you create a Reflection, modify worksheets and make note of the time it takes for the dashboard to update so you can compare when a Reflection is in place.
- Open the
NYC-Trips-Dashboard.twbxworkbook in Tableau. - Sign into Dremio Cloud through Tableau. If your user account has access to more than one organization, sign into the organization where you added the Samples source.
- In the workbook, open the worksheet Average Fare and Average Tip.
- Modify the sheet to show the average fare and average tip per year. Note that the update takes about twelve seconds.
- Modify the sheet to show the averages per month. Note that this update, too, takes about twelve seconds.
- Change the time aggregation on the sheets Average and Sum Total Amount and Number of Rides by Month. Note that the updates also each take about twelve seconds.
The dashboard updates are fast but users expect instantaneous updates. Create a Reflection to optimize the response time.
Step 2. Create an Aggregation Reflection
An aggregation reflection is a type of Reflection that pre-aggregates data, so aggregation does not need to happen every time a query is run on a dataset.
- On the Datasets page, go to Sources > Object Storage > Samples in the panel on the left.
- On the right, click samples.dremio.com.
- Hover over the row for
NYC-taxi-trips-icebergand click to the right.
 - Click the Reflections tab at the top of the page.
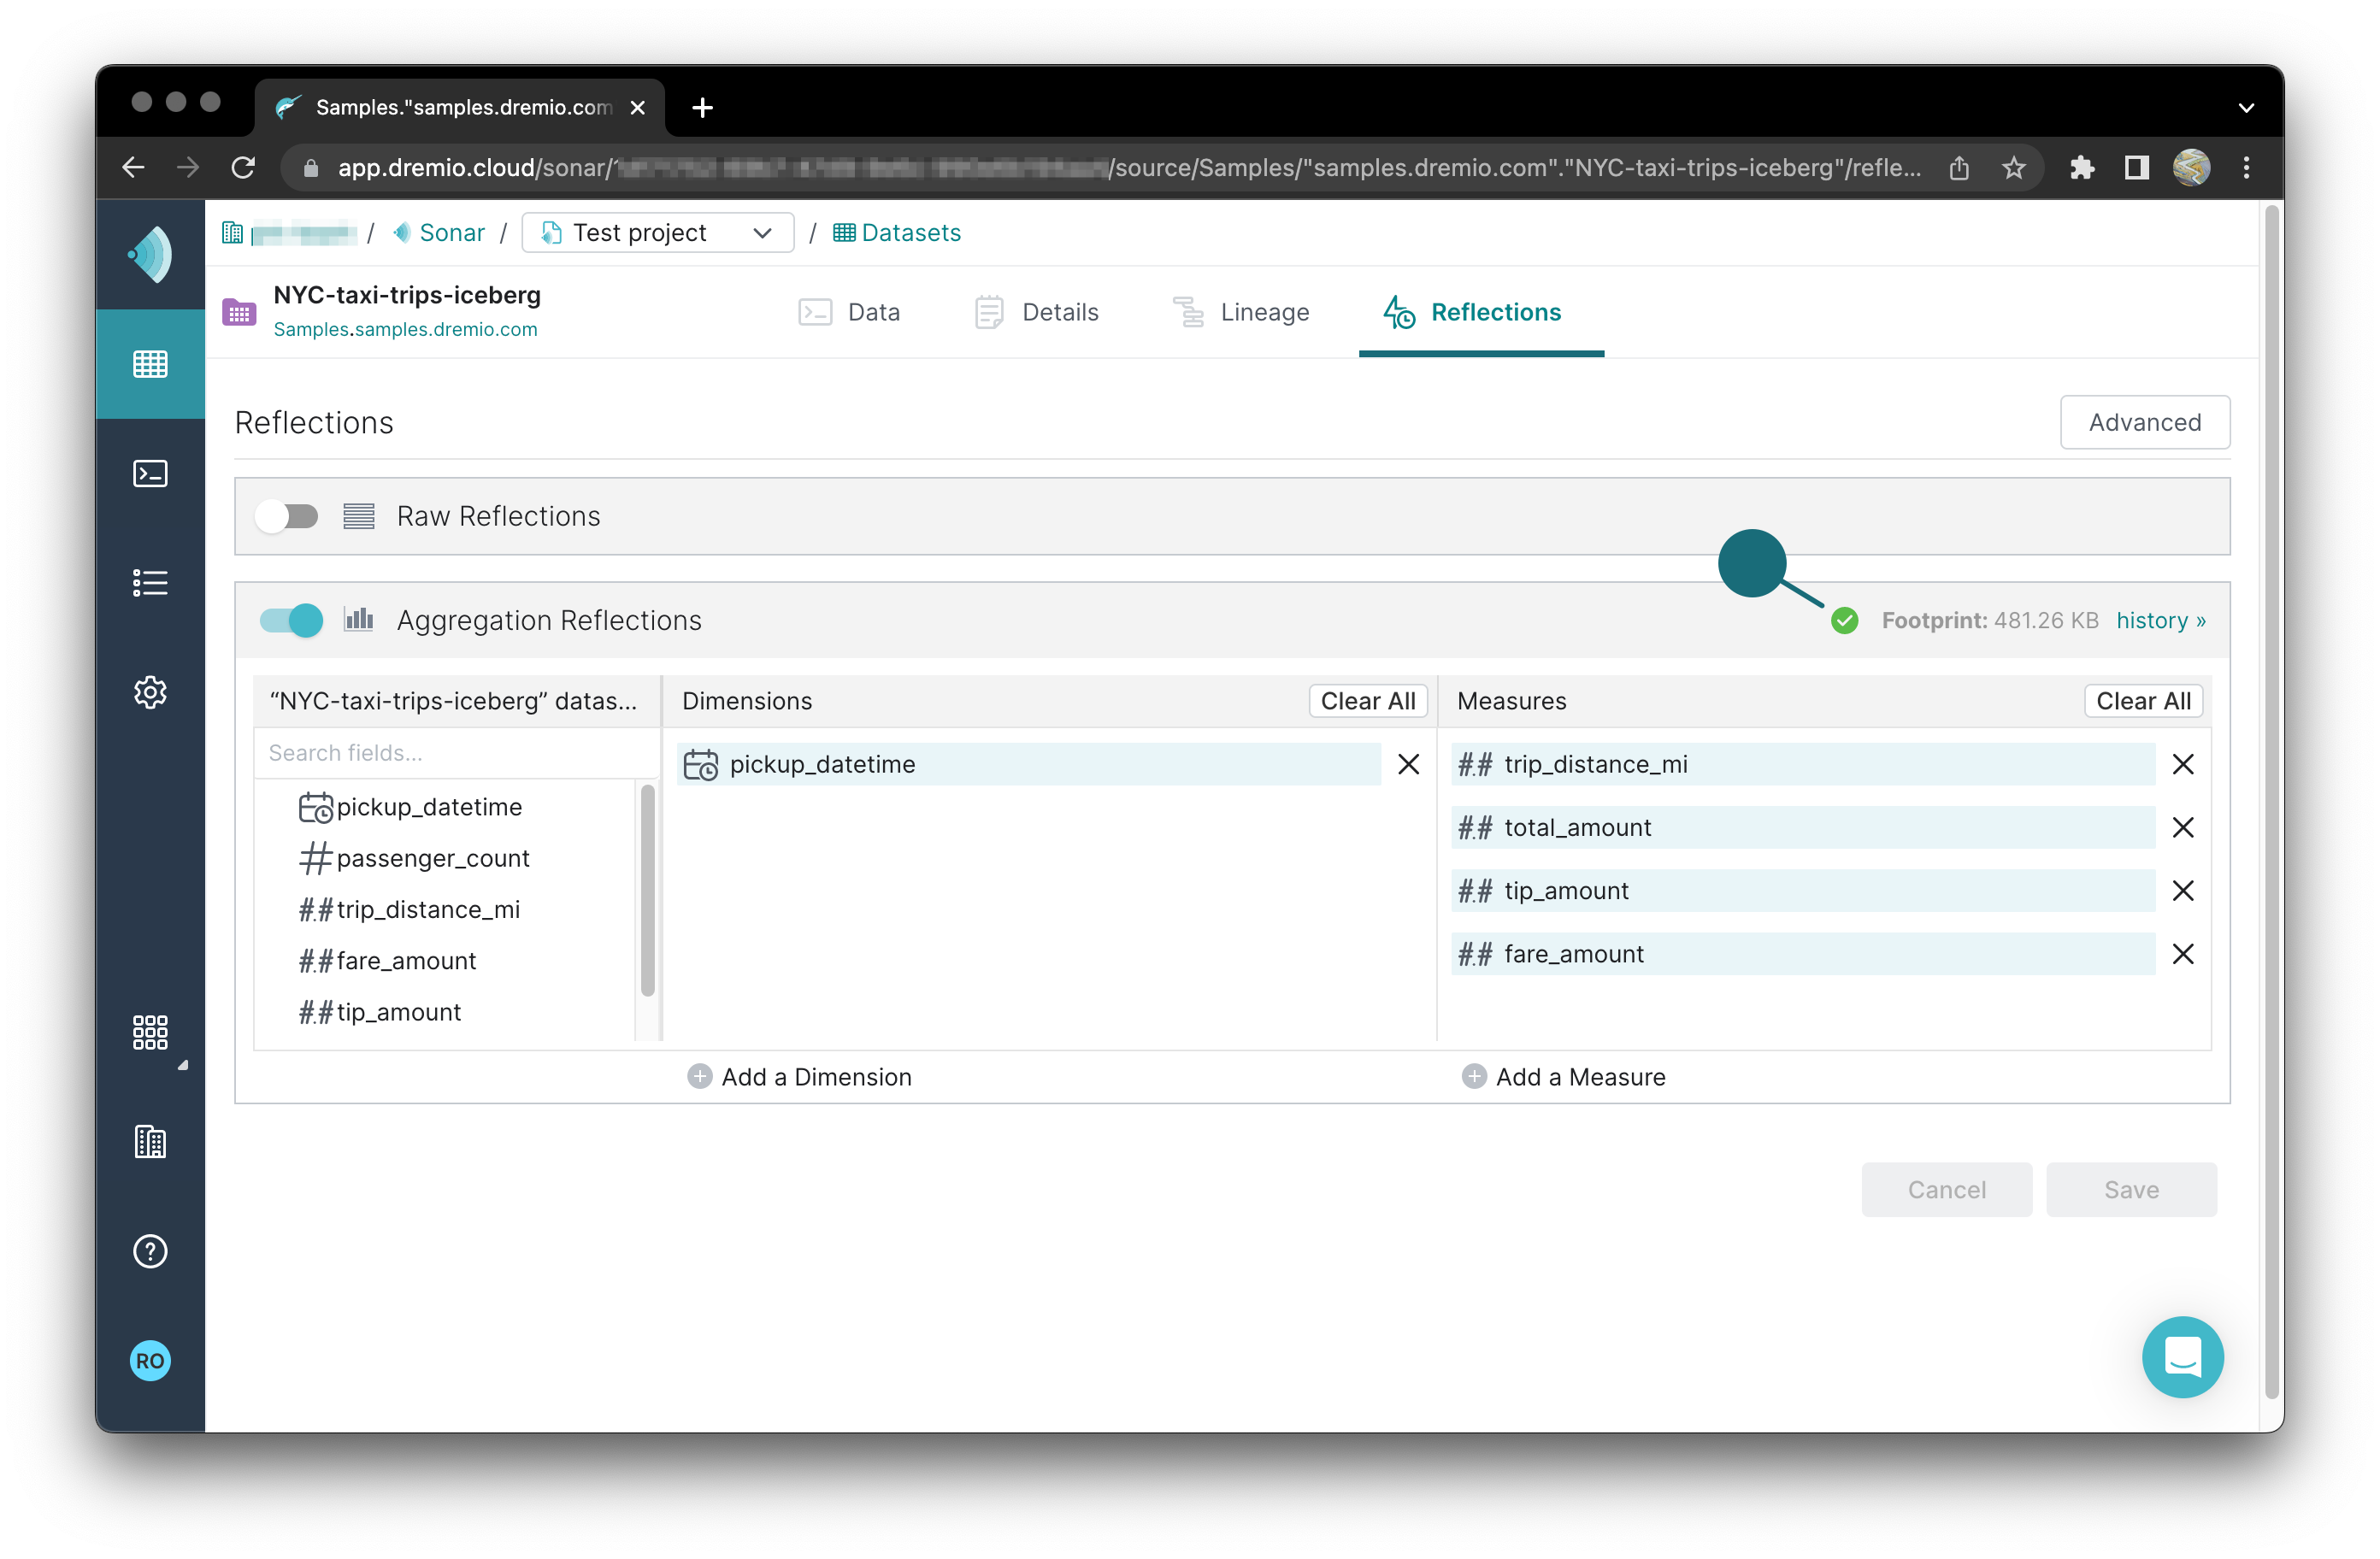
- Click the toggle switch in the Aggregation Reflections bar. The columns from the table are pre populated under Dimensions and Measures. Dimensions are qualitative values (such as names, dates, or geographical data). Measures are numeric, quantitative values that you can measure.
- Under Dimensions, remove the
passenger_countfield. - Click Save. The green circle with the checkmark indicates that the Reflection is ready for use.

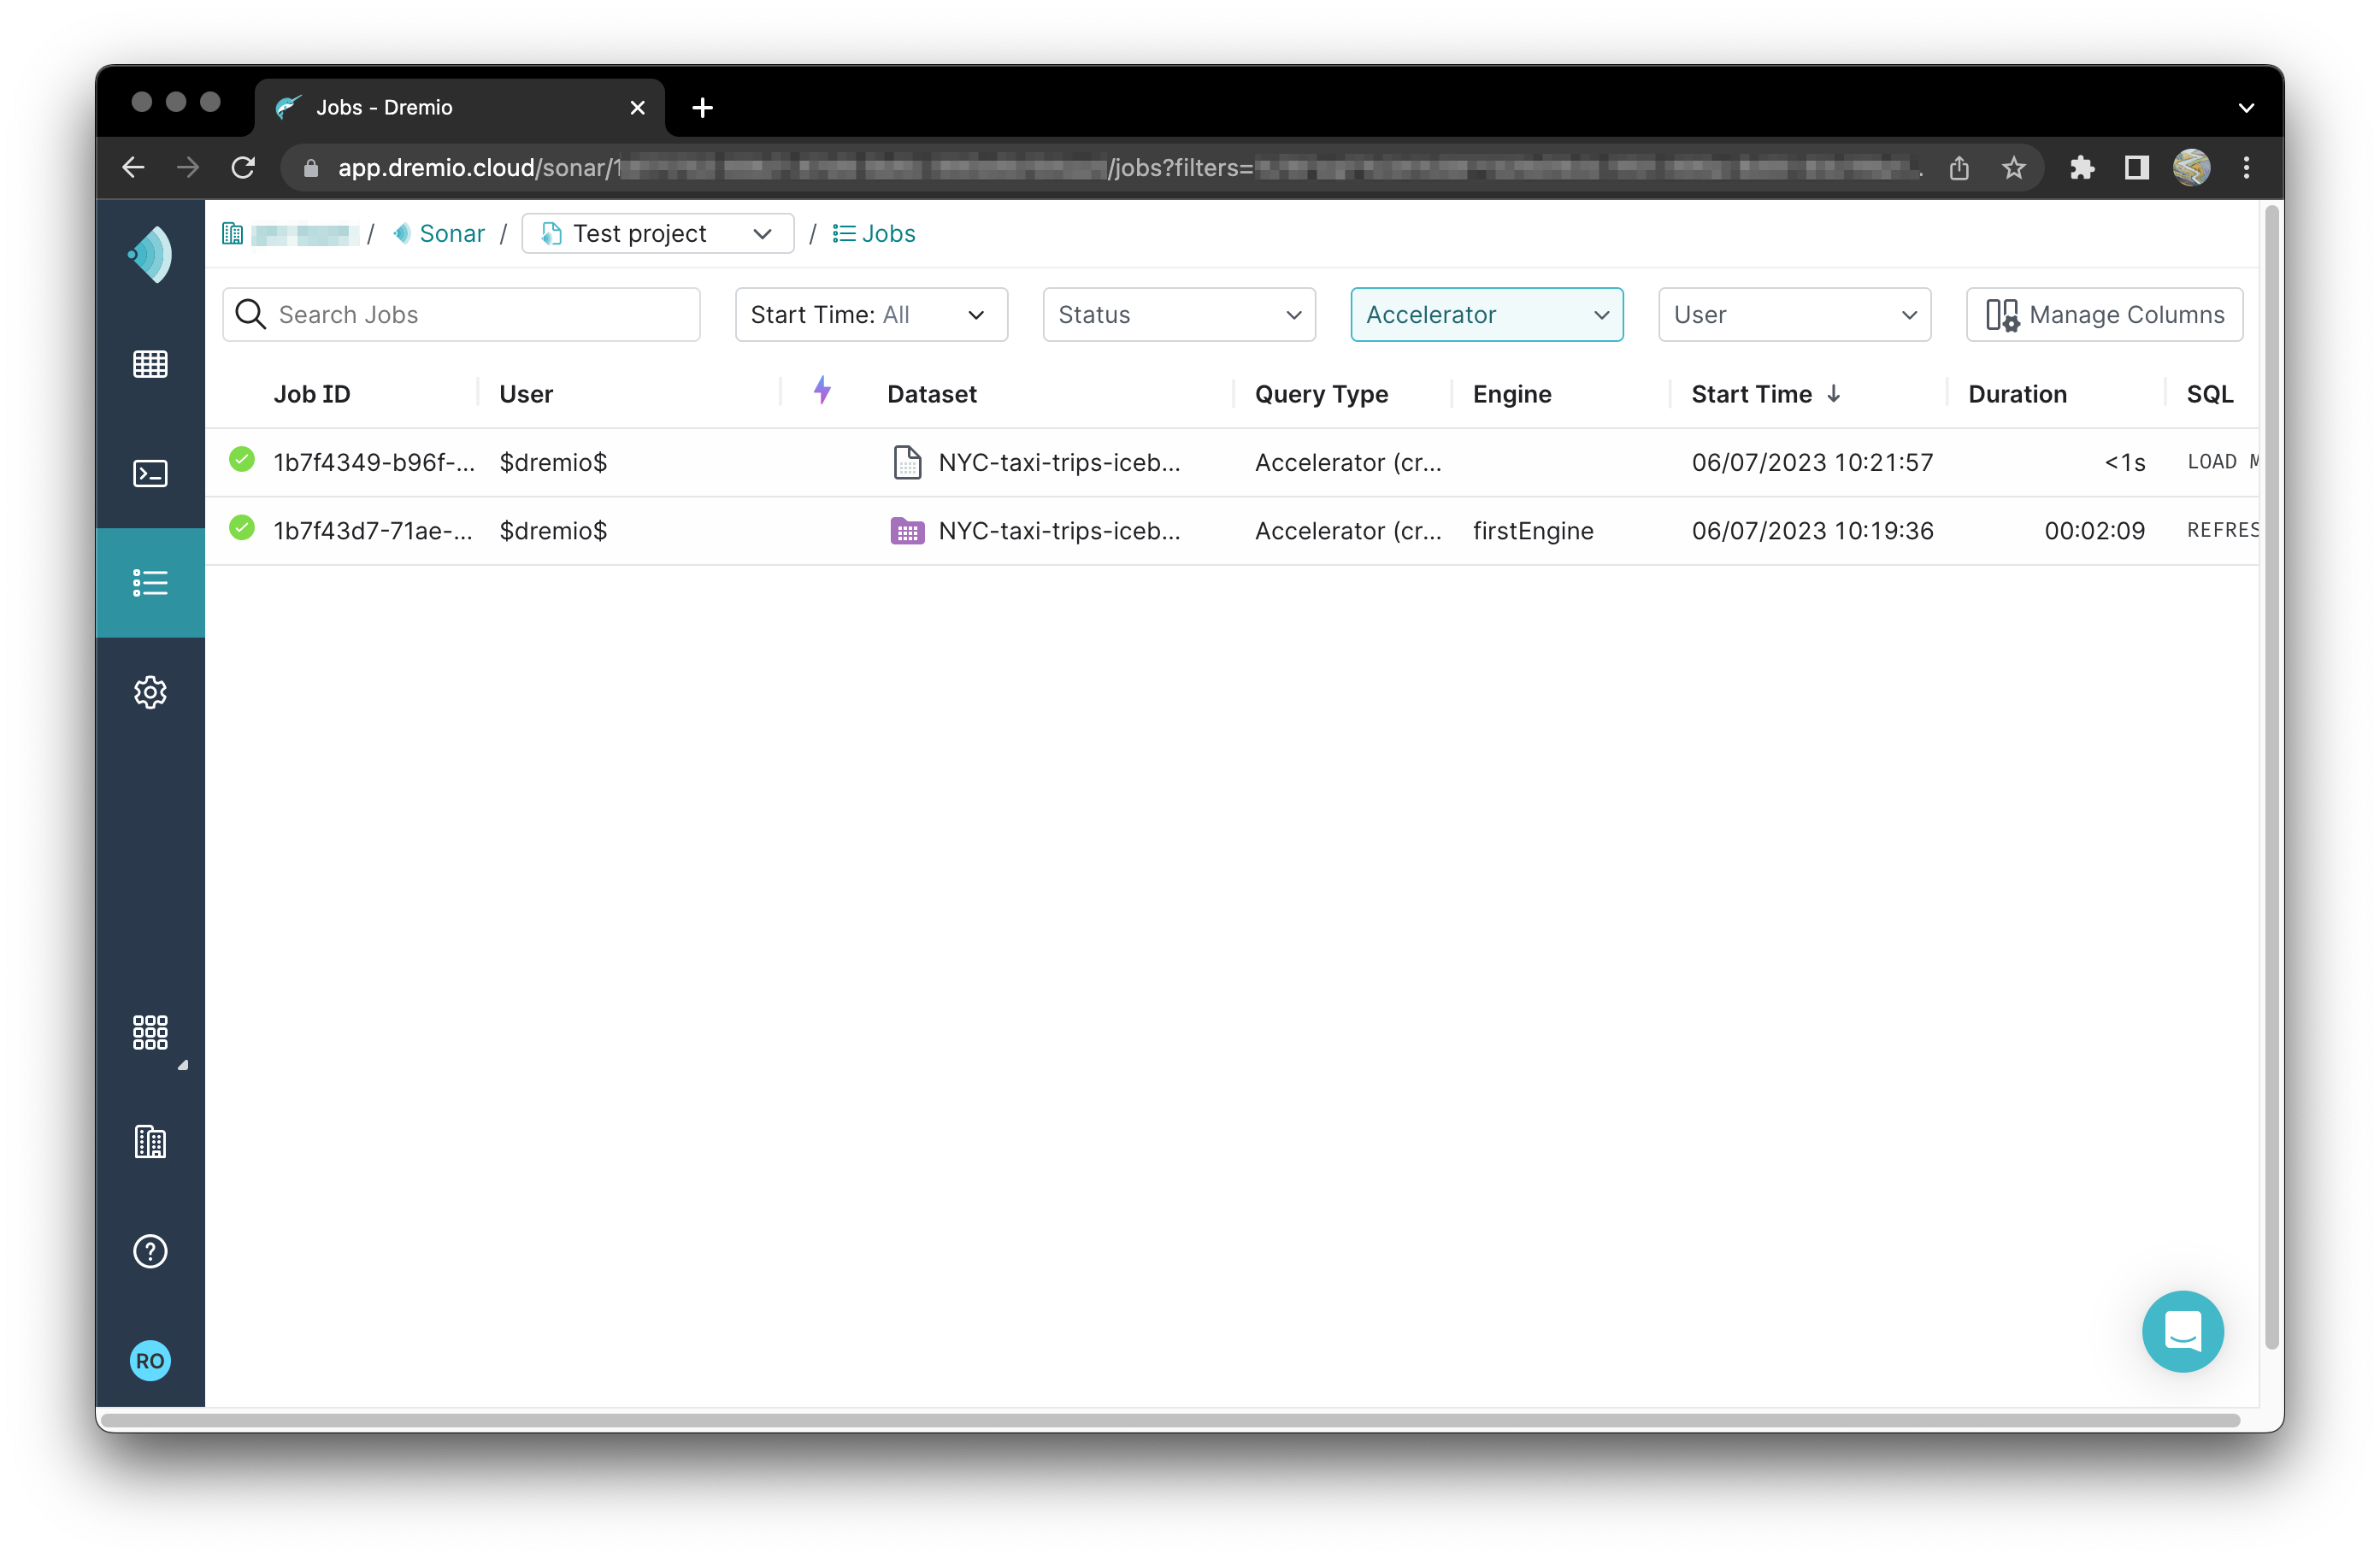
- To the right of the name of the Reflection, click History to view the two successive jobs that create the Reflection and wait for them in finish in a few seconds. As each job runs, a spinner appears in front of it. When each job ends, the spinner is replaced by a white checkmark in a green circle. When both checkmarks appear, the Reflection is ready to accelerate updates to the dashboard.

You can also create Reflections using SQL by adding a Reflection to a dataset.
Step 3. Modify the Dashboard Again to See Faster Update Times
Now that the acceleration has been created, modify the worksheets again to see instantaneous changes in the dashboard.
-
Open the
NYC-Trips-Dashboard.twbxworkbook in Tableau. If prompted, sign into Dremio Cloud from Tableau. -
In the workbook, open the worksheet Average Fare and Average Tip.
-
Modify the sheet to show the average fare and average tip per quarter.
-
Modify the sheet to show the averages per year.
-
Change the time aggregation on the sheets Average and Sum Total Amount and Number of Rides by Month.
-
To verify that the updates to the dashboard were accelerated by the Reflection, open the Jobs page by clicking
 in the side navigation bar in the Dremio Console.
The jobs that updated the dashboard all show a purple lightning bolt  to indicate that they were accelerated by the Reflection.
If you are using a project shared with other users, filter the list of jobs by your username by selecting your username from the User dropdown at the top fo the page.
Wrap-up and Next Steps
You've seen how a Reflection can accelerate updates to a dashboard, and you've created an aggregation Reflection in the Dremio console. Now you're ready to take the next steps:
- Learn about the different types of reflections, and the best practices for creating them.
- Try creating Reflections for some of your workloads to optimize performance and cost. See Creating and Editing Reflections for the steps of using the Dremio console. See ALTER TABLE for the SQL commands. See Reflection for the REST API.