Building Your First Data Product in Dremio
This guide explains how to build your first data product.
Data products are reusable data assets that stakeholders throughout your organization can access. Data products provide a curated and reliable way to transform data into insights and as a single source of truth, ensuring that everyone in your organization works from the same data. For example, if the marketing team in your organization needs to analyze customer behavior across multiple channels, a data product gives them a unified view of customer interactions so that they can tailor campaigns more effectively.
Step 1. Accessing Your Project
Use the email or URL invitation from your organization to activate your account and log in to Dremio Cloud:
- Open the invitation URL or click Join Organization in the email.
- On the Welcome to Dremio page, create a password or log in with an identity provider.
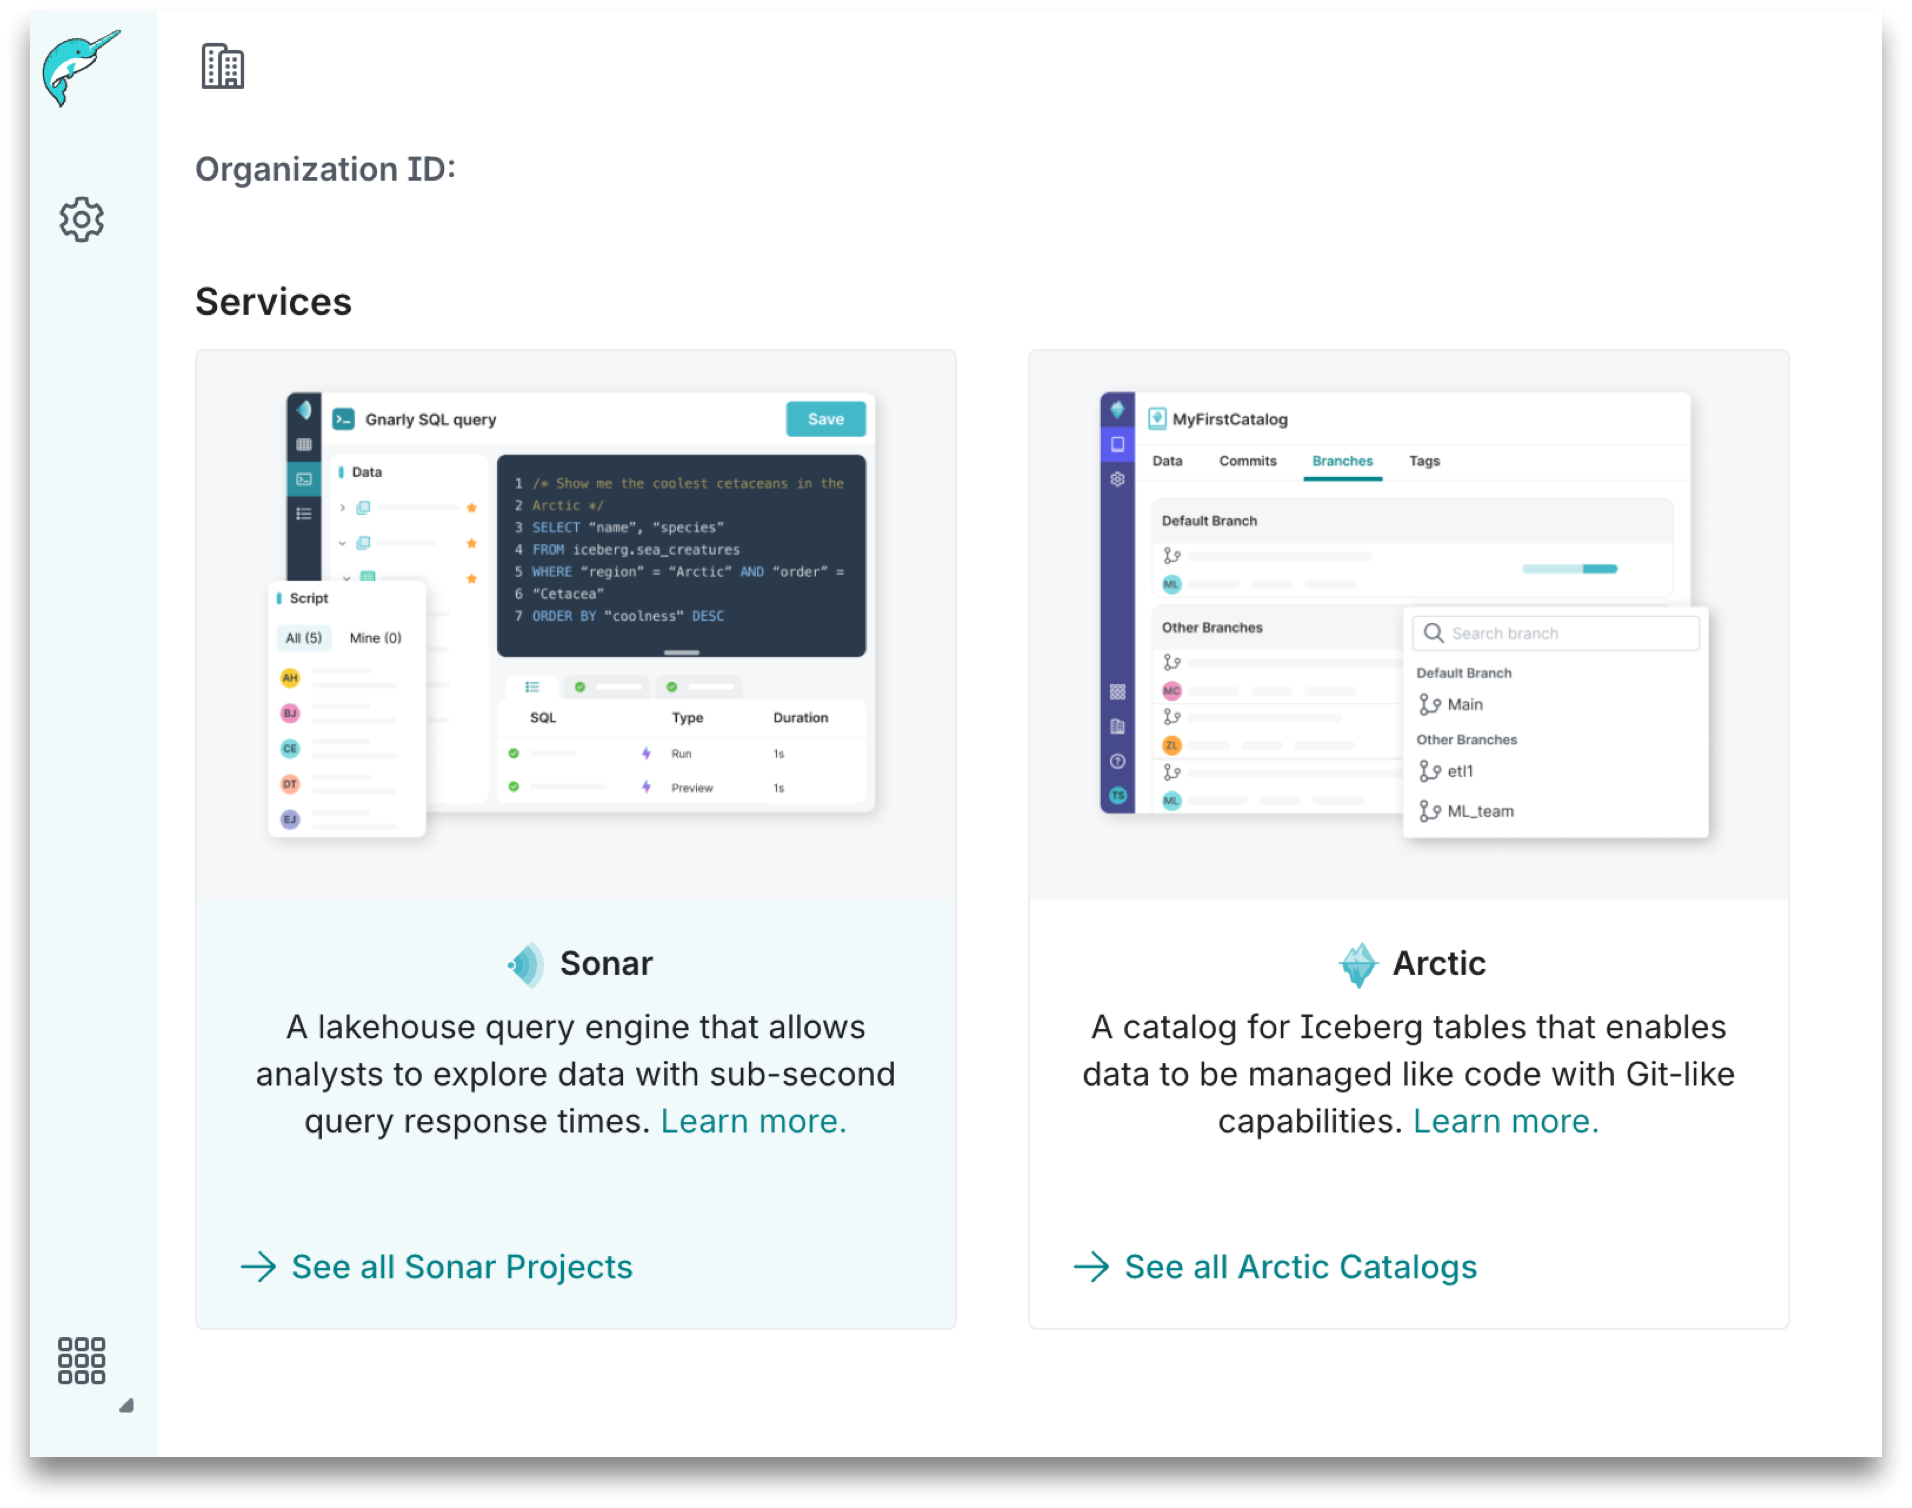
- Under Services, click the Sonar panel to open the list of projects in the organization.
- Select a project to open the Datasets page for the project.
Step 2. Defining Your Business Question
The first step in any data analysis process is to define the business question you want to answer. This question determines what data you explore, select, and analyze to ensure that your findings align with the business objective. A poorly defined question can lead to misleading results.
For the purposes of this guide, suppose you want to explore the relationship between weather conditions and tipping behavior in taxi rides. A business question might be: "Do people tip more during taxi rides when it's raining?" To answer the question, you need the fare amount, tip amount, date, and precipitation level data.
| Business Question | Datasets Required | Key Data Points |
|---|---|---|
| Example: "do people tip more when it's raining?" | nyc-taxi-trips.csv, nyc-weather.csv | fare amount, tip amount, date, precipitation level |
This guide relies on sample data to answer the example business question. You can follow along using sample data or try answering your own business question using other relevant datasets in your organization, if available.
To access sample data:
- In the side menu, under Object Storage, click Samples.
- Navigate to the
samples.dremio.comfolder.
If the Samples data source is not listed in the left panel on the Datasets page, contact your organization administrator.
Step 3. Exploring Available Data
Exploring available data helps you assess the quality of the data to determine if it's relevant to your business questions.
To answer the business question "do people tip more when it's raining?", we need to verify if the NYC-taxi-trips-iceberg file contains relevant data points, such as fare amount and dates, that help answer the example business question. To follow along:
-
Click
 in the side navigation bar.
 -
Copy and paste the SQL command below to view the data.
SQL to view dataSELECT *
FROM Samples."samples.dremio.com"."NYC-taxi-trips-iceberg"
LIMIT 10; -
Click Run to execute the query.
-
Go through the columns and data types to ensure the result is accurate given your query or if something is formatted incorrectly.
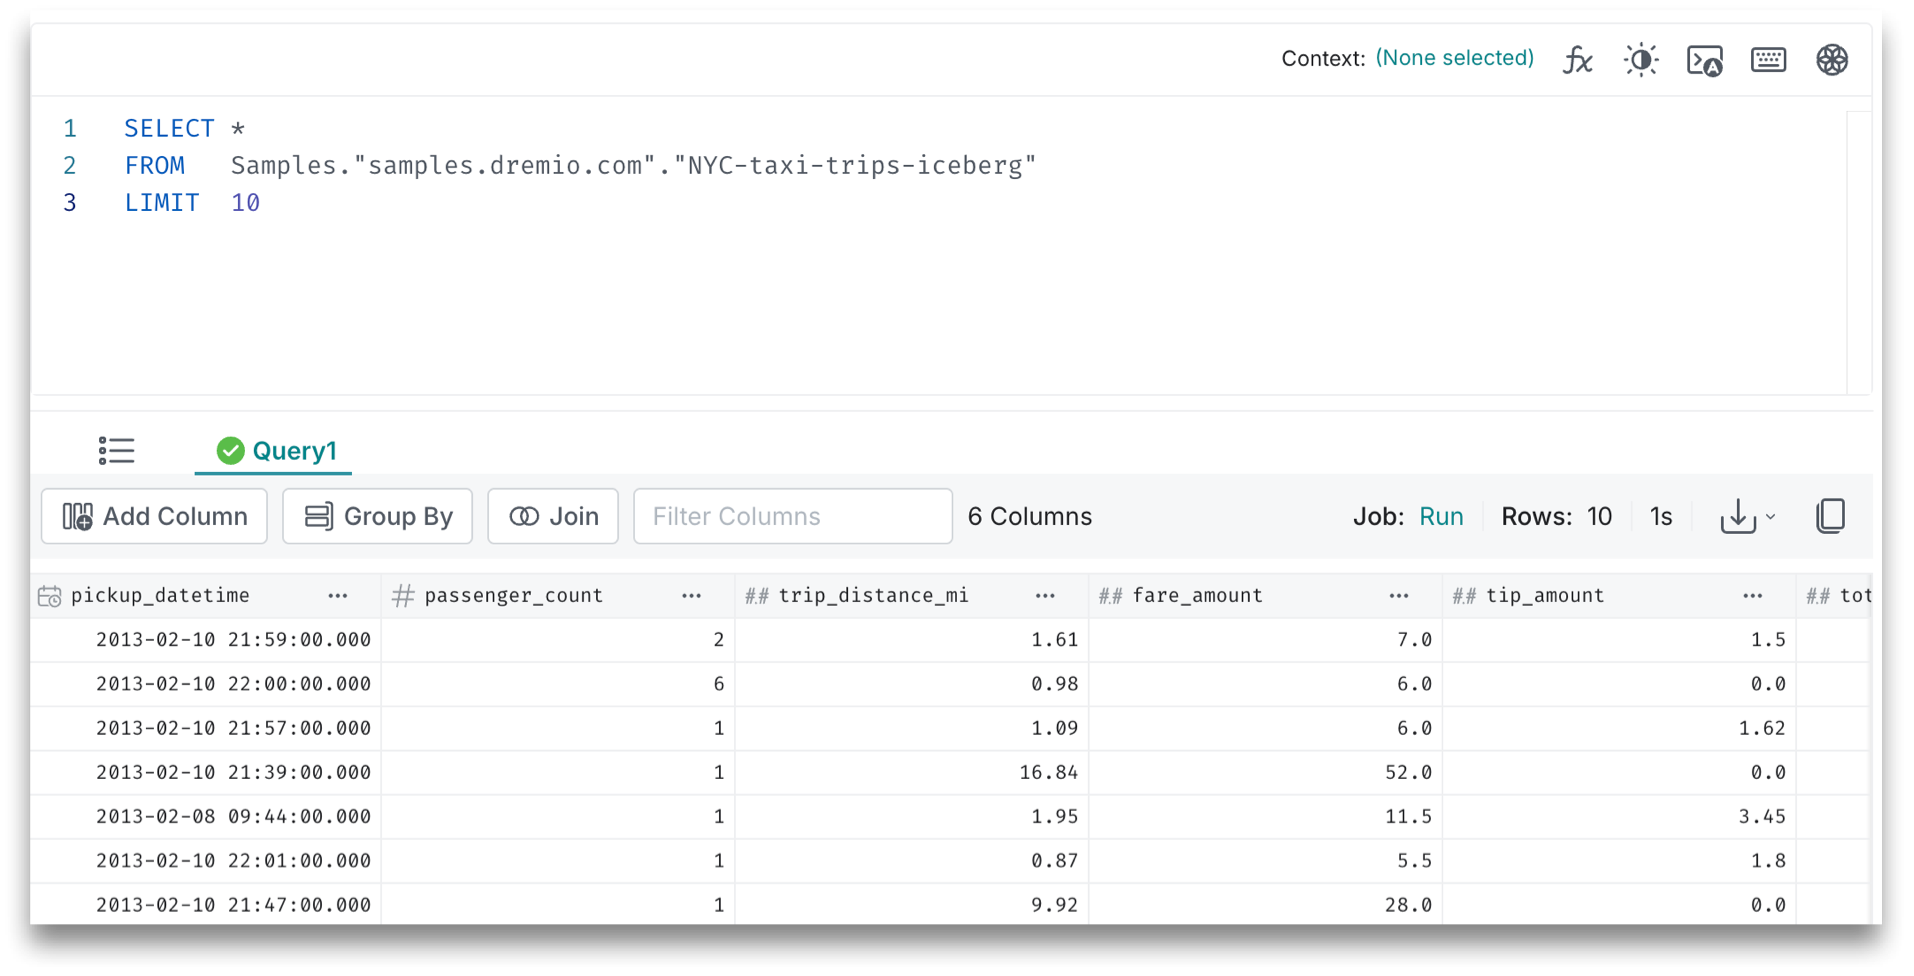
The data on trip distance, date, and tip amount provide key insights to begin answering the business question about tipping behavior in different weather conditions.
Next, we obtain additional insights on weather from the NYC-weather file. This file contains information such as precipitation levels, temperature, and other weather-related data points, which are crucial for our analysis. To follow along:
-
Click
in the side navigation bar. -
Copy and paste the SQL command below to view data.
SQL to view dataSELECT *
FROM SampleDB."NYC-weather"
LIMIT 10; -
Click Run to execute the query.
-
Go through the columns and data types to ensure the result is accurate given your query or if something is formatted incorrectly.
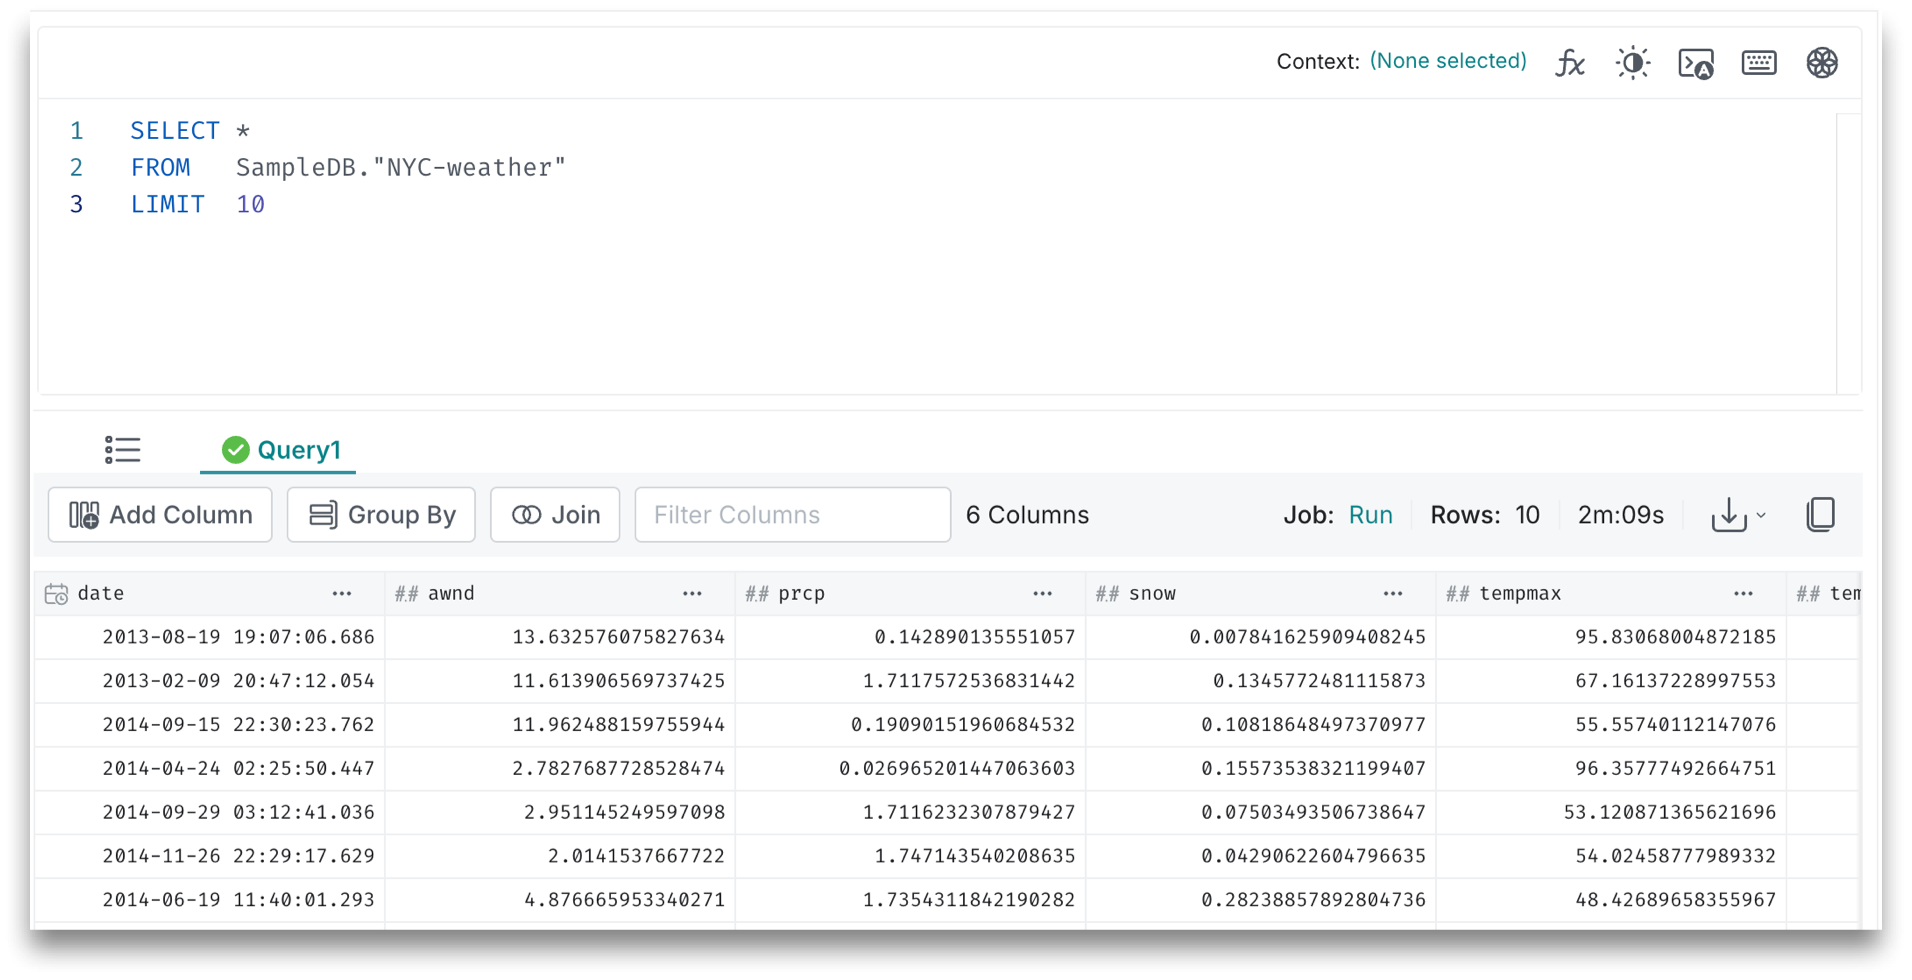
Including data on precipitation levels allows us to deepen our analysis by examining how changes in rainfall correlate with variations in taxi tips. By comparing tip amounts under different precipitation conditions, we can better understand whether rain influences tipping behavior and move closer to answering our business question.
To apply this process to your own business question, start by navigating through the data sources relevant to your project, if available. Open and explore the datasets that are most likely to contain the information you need. Then carefully review the columns, data types, and any available lineage information to determine if the datasets are suitable for analysis.
After determining which datasets are relevant to the business question, you can join them together to create your data product.
Step 4. Curating Data
Ensuring data accuracy and relevance is key to producing reliable insights. This can involve cleaning, transforming, and reviewing data to ensure it is accurate and correctly formatted for your analysis.
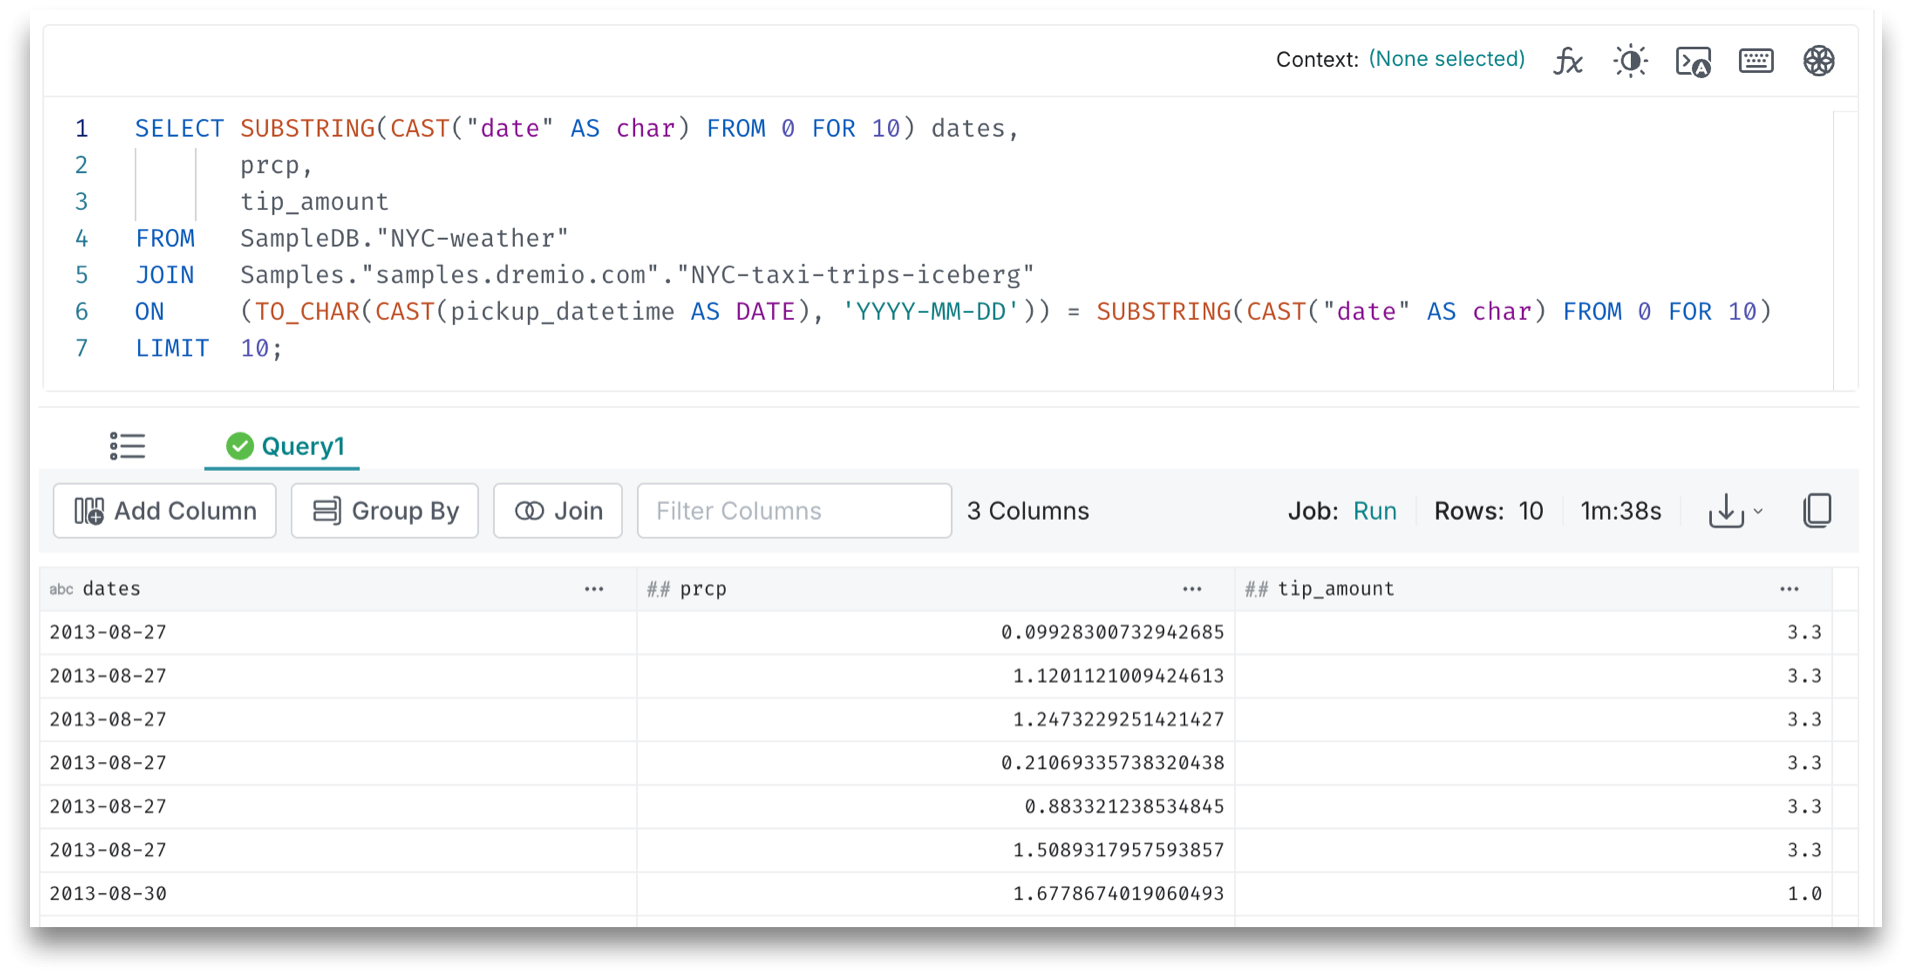
To get the answer to the example business question, combine the data in the NYC-weather and NYC-taxi-trips-iceberg datasets so that you can see whether tipping patterns change on rainy days. To do this, run a SQL query that joins the two datasets on a common field, the date. To follow along:
- Join the datasets by running the SQL below.
SELECT SUBSTRING(CAST("date" AS char)FROM 0 FOR 10) dates,
prcp,
tip_amount
FROM   SampleDB."NYC-weather"
JOIN Samples."samples.dremio.com"."NYC-taxi-trips-iceberg"
ON (TO_CHAR(CAST(pickup_datetime AS DATE), 'YYYY-MM-DD')) = SUBSTRING(CAST("date" AS char) FROM 0 FOR 10)
LIMIT  10;
- Go through the output and confirm the result displays the key data points.
To apply this step to your own business question, identify available datasets in your organization that contain the relevant information, if available. Use similar join techniques to merge your data sources, and thoroughly review the results to ensure they are accurate and relevant to your specific analysis.
Step 5. Creating a View
In Dremio, views are virtual tables based on the result set of a query. You can create views from data that reside in any data source, folder, table, or view that you have access to. You can also share views you've created with stakeholders in your organization. To follow along:
- Review the amount of tips and how it fluctuates as precipitation changes over time.
- Click Save as View to create a view of your query that others can access.
This step can also be tailored to your own business question. For example, if you're analyzing sales trends rather than taxi tips, review the data relevant to your question, such as sales figures across different regions. The goal is to create a view that highlights the key data points you're interested in.
Step 6. Documenting Your Findings
A well-documented view serves as a valuable resource that can be easily referenced across teams in your organization.
In Dremio, you can document your data product manually or generate documentation automatically. The best approach depends on the complexity of your data product and your team's needs. Generating the documentation is a quick way to capture basic information like data sources, transformations, and schema details without manual input. It is most useful for straightforward data products or as a starting point to expand at a later time.
For the view in this example, here's how to generate documentation automatically:
- From the Datasets page, navigate to your newly created view.
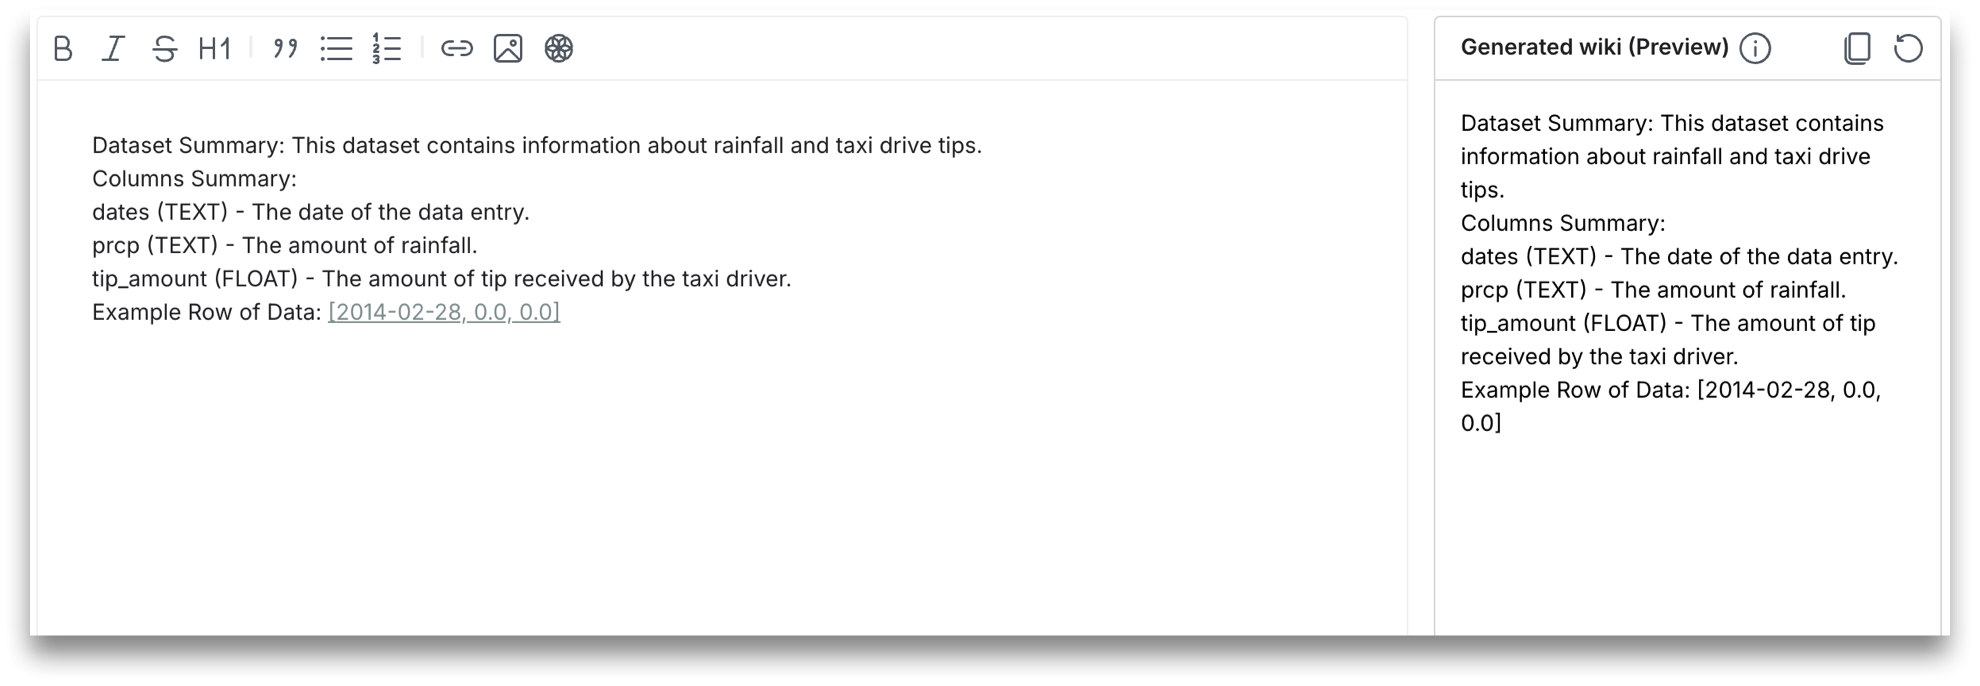
- In the right panel, under Wiki, click Generate Wiki. The Wiki dialog appears.
- When the wiki generates in the Wiki dialog, review the preview on the right side and make any desired edits in the editor on the left side.
- Click Save.
Step 7. Finalizing Your Data Product
You've successfully created and documented your view. As you build additional data products, make sure to store them in a dedicated folder to share them with others in your organization. To add a folder:
- Browse through the folders in your organization and click
 .
. - In the dialog that opens, enter a name for your folder.
- Click Add.
In the future, you can also use Reflections to ensure that your queries run efficiently, especially if you work with large datasets. In Dremio, Reflections are optimized materializations of source data or a query, similar to a materialized view that is derived from an existing table or view. For more information, see Creating and Editing Reflections.
Step 8. Exporting to Tableau (optional)
If you use Tableau and you want to present your findings to your stakeholders in a visual way, you can export your view as a .tds file.
To export your view:
- In the Dremio console, navigate to your view and click on it.
- Click
 in the right panel to export a
 .tdsfile that represents your view. - Log in to your Tableau account and import the
.tdsfile.
When creating your dashboard in Tableau, connect it to your view in Dremio to ensure that the data feeding your visualizations is up-to-date and reflects the latest insights from your analysis. It is also recommended that you regularly update your Tableau dashboard as your analysis evolves to ensure stakeholders work with the most current information.
As you design your dashboard, focus on the most critical insights you want to highlight. The example in this guide analyzes the correlation between rainy weather and taxi tips. You can create visualizations that depict similar relationships and tell a cohesive story. For more information, see Tableau.