Datasets
To analyze data from a data source, files must be formatted into tables in Dremio Sonar. You can then create views from one or more tables. The following figure shows how data is represented in Sonar:
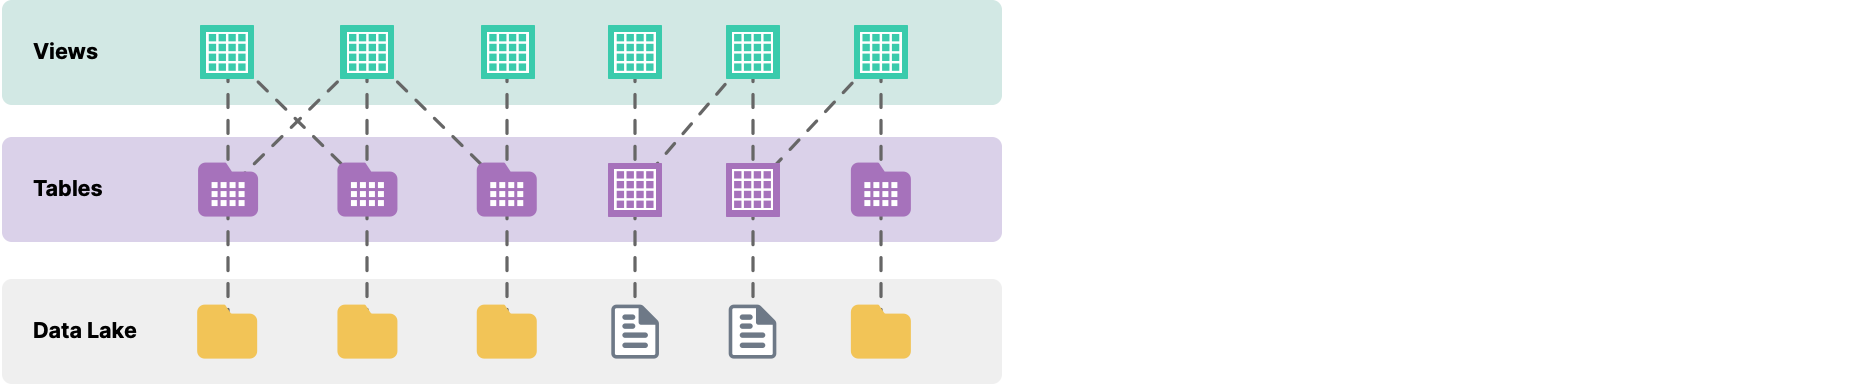
Tables
A table contains the data from your source, formatted as rows and columns. A table is represented by the ![]() icon.
icon.
Apache Iceberg tables are represented by the ![]() icon. Tables in Arctic catalogs use the Iceberg table format by default.
icon. Tables in Arctic catalogs use the Iceberg table format by default.
You can use Dremio Sonar to load data into and make changes to Iceberg tables with commands like INSERT, UPDATE, DELETE, and MERGE. For more information on how Dremio Sonar works with Iceberg, go to Apache Iceberg.
Formatting a Table
See formatting tables and views for more information on how to format a file or folder as a table.
Removing Formatting on a Table
Removing the formatting on a table will revert the table to the folder or file format that it was originally in. For the steps, see Removing Formatting on Data.
Maximum Number of Leaf Columns in a Table
The term leaf columns refers to all columns in a table and all leaf-level fields that are used in complex data types in the table. Tables in Dremio are allowed a maximum of 6,400 leaf columns. For example, if a table has 1,000 columns and the data type of one column is a STRUCT that has three fields, the count of leaf columns is 1,003.
Maximum Number of Leaf Columns Scanned Per Table in a Query
The maximum number of leaf columns that a query is allowed to scan per table or per Reflection is 800. If a query attempts to scan more than this limit, then you receive this error message:
At most, <limit> columns including leaf level fields of complex type are allowed to be scanned, but the query is scanning <number>. Please include the columns you want to be returned from the query and try again.
If you are trying to use a SELECT * query to view all columns in a table, you can avoid scanning too many columns by using the DESCRIBE TABLE command, which returns the name and other details about all columns in the table.
Retrieving a Table Definition
Only for Arctic tables, you can retrieve the table definition, and in order to retrieve, you will need the SELECT privilege on the table. Because tables cannot be modified, you can't make edits to the table definition but you can retrieve the definition to understand where the table was derived from and to use it as a template for creating new views.
To see a table definition on the Datasets page, choose any one of these options:
-
Hover over the table name and click
 in the top right corner of the metadata card.
 -
Hover over the line containing the table and click
on the right. -
Hover over the line containing the dataset, click
 on the right, and select Go to Table.
The table definition opens in the SQL editor.
If you want to use this table definition to create a view, see Creating a View.
If you have the SELECT privilege on an Arctic table, you can run SHOW CREATE TABLE <table_name> in the SQL editor to see the table definition. See SHOW CREATE TABLE.
Views
A view is a virtual table based on the result set of a query. Views do not contain any data. You can create views from data that resides in any data source, folder, table, or view that you have access to.
Views stored in Arctic catalogs leverage the Iceberg view specification. Iceberg views are represented by the ![]() icon.
icon.
Creating a View
You can create a view from an existing table or view. Create a view from a table by performing the following steps:
- Compose the query as required and click Run to validate the query. After running the query, click the arrow next to Save Script As in the top right of the SQL editor, and select Save View as... from the drop-down menu.
- Clicking Save View as... prompts you to name the new view and select from a list of folders where it will be stored. Provide a name and select a folder to store it in.
- To see the new view, use the Datasets page to navigate to the folder where you saved the view, then click the view to see the data.
Example: Creating a View
This example shows how to create a view from the SF weather 2018-2019.csv table by performing the following steps:
-
On the Datasets page, trace the SF weather 2018-2019.csv table in the corresponding source folder and click it. To create a view, change the data type of the ELEVATION into number by running the following query.
Query to change ELEVATION data typeSELECT TO_NUMBER(ELEVATION, '##.##') AS ELEVATION FROM "SF weather 2018-2019.csv" -
Click the arrow next to Save Script As in the top right of the SQL editor, and select Save View as... from the drop-down menu.
-
Clicking Save View as... prompts you to name the new view and select from a list of folders where it will be stored. Provide a name and select a folder to store it in. Name the view SFWeatherElevation.
-
On the Datasets page, navigate to the folder that contains the SFWeatherElevation view. Click the view to see the query and data. You can see the table with a single Elevation column and the following query.
Query for SFWeatherElevationSELECT * FROM SFWeatherElevation
Retrieving a View Definition
If you have the SELECT privilege for a view, you can see the underlying definition in the SQL editor but cannot edit the view directly.
To see a view definition on the Datasets page, choose any one of these options:
-
Hover over the view name and click
in the top right corner of the metadata card. -
Hover over the line containing the view and click
on the right. -
Hover over the line containing the view, click
on the right, and select Go to Dataset.
The view definition opens in the SQL editor.
If you want to use this definition to create another view, see Creating a View.
If you have the required privileges, you can run SHOW CREATE VIEW <view_name> in the SQL editor to see the view definition. See SHOW CREATE VIEW.
Editing a View
If you have the privileges required to edit a view, you can see and edit the definition of the view.
To edit a view, complete the following steps:
-
On the Datasets page, choose any one of these options:
-
Hover over the view name and click
 in the top right corner of the metadata card.
 -
Hover over the line containing the view and click
on the right. -
Hover over the line containing the view, click
on the right, and select Edit.
-
The view definition opens in the SQL editor.
-
In the SQL editor, make changes to the view definition.
-
Click Save View in the top right corner of the SQL editor.
Removing a View
Perform the following steps to remove a view:
- Use the Datasets page to navigate to the folder where your view is located.
- Hover over the view and click that appears next to the view.
- From the list of actions, click Remove.
- Confirm that you want to remove the view.
If you are removing a table or view with children, you get a warning. Removing a table or view with children leaves you with disconnected views that you can no longer query.
Dataset Metadata Card
Each dataset has a metadata card that contains details about the dataset. To view the metadata card, hover over a dataset in the Datasets page. The components of the metadata card are described below:

| Location | Description |
|---|---|
| 1 | Icon represents the dataset format as a table |
| 2 | Card title displays the dataset name. |
| 3 | |
| 4 | Click |
| 5 | Click either |
| 6 | The path where the dataset is located. |
| 7 | The Arctic branch reference for the context. |
| 8 | The date and time when the dataset was last updated. |
| 9 | Launch a BI tool to analyze your data. |
| 10 | Details Panel: Click this link to open the dataset details panel on the right side of the browser window. In the details panel, you can add or remove labels on the dataset and add or modify wiki content. |
| 11 | Columns: The number of columns in the dataset, including the name and data type of each column. Columns with partitions (if any) use a separate partition icon. |
- For datasets that are not on the main branch, the metadata does not include BI tools, labels, and wiki content.
- When viewing a metadata card in the SQL Runner's data panel, the Columns section at the bottom of the card is not displayed because columns can be displayed by expanding the dataset.
Wikis and Labels
You can build upon datasets using wikis and labels to enhance discoverability and understanding of the data across your organization. You can use the wiki to provide a description of the dataset or content that helps users get started with the data, such as examples, usage notes, or points of contact for questions or issues. Wikis support Markdown for formatting.
You can also add labels to datasets to easily categorize and help business users identify relevant data. For example, you can add a PII label to a dataset to indicate that it contains personally identifiable information.
Managing Wikis and Labels
Ensure you have sufficient Role-Based Access Control (RBAC) privileges to view or edit wikis and labels.
To view or edit the wiki and labels for a dataset:
- On the Datasets page, navigate to the folder where your dataset is stored.
- Hover over your dataset, and on the right hand side, click on the icon.
- Click Open Details Panel.
- You can add a label by clicking on the icon, typing a label name (e.g.
PII), and clicking Enter. - You can edit the dataset wiki by clicking Edit wiki, writing your wiki content, and clicking Save.
- You can add a label by clicking on the
Generating Labels and Wikis Preview
To help eliminate the need for manual profiling and cataloging, you can use Generative AI to generate labels and wikis for your datasets. For an example, see the Generating Labels and Wikis tutorial.
If you haven't opted into the Generative AI features, see Dremio Preferences for the steps on how to enable.
Generating Labels
In order to generate a label, Generative AI bases its understanding on your schema by considering other labels that have been previously generated and labels that have been created by other users.
To generate labels:
-
Navigate to either the Details page or Details Panel of a dataset.
-
In the Dataset Overview on the right, click
 to generate labels.
 -
In the Generating labels dialog, review the labels generated for the dataset and decide which to save. If multiple labels have been generated, you can save some, all, or none of them. To remove, simply click the x on the label.

-
Complete one of the following actions:
-
If these are the only labels for your dataset, click Save.
-
If you already have labels for the dataset and want to add these generated labels, click Append.
-
If you already have labels for the dataset and want to replace them with these generated labels, click Overwrite.
The labels for the dataset will appear in the Dataset Overview.
-
Generating Wikis
In order to generate a wiki, Generative AI bases its understanding on your schema and data to produce descriptions of datasets, because it can determine how the columns within the dataset relate to each other and to the dataset as a whole.
You can generate wikis only if you are the dataset owner or have ALTER privileges on the dataset.
To generate a wiki:
-
Navigate to either the Details page or Details Panel of a dataset.
-
In the Wiki section, click Generate wiki. A dialog will open and a preview of the wiki content will generate on the right of the dialog. If you would like to regenerate, click
 .
.

-
Click
 to copy the generated wiki content on the right of the dialog.
 -
Click within the text box on the left and paste the wiki content.
-
(Optional) Use the toolbar to make edits to the wiki content. If you would like to regenerate, click
in the toolbar to regenerate wiki content in the preview. -
Click Save.
The wiki for the dataset will appear in the Wiki section.
Best Practices
Layering Tables and Views
Dremio recommends that you organize tables and views into layers that represent various stages of refinement:
- The first (bottom) layer consists of your raw tables.
- The second layer consists of views, one for each table, that do lightweight preparation of data for views in subsequent layers. Here, administrators might create views that do limited casting, type conversion, and field renaming, and redacting sensitive information, among other prepping operations. Administrators can also add security by subsetting both rows and fields that users in other layers are not allowed to access. The data has been lightly scrubbed and restricted to the group of people who have the business knowledge that lets them use these views to build higher-order views that data consumers can use. Then, admins grant access to these views to users who create views in the next layer, without being able to see the raw data in the tables.
- In the third layer, users create views that perform joins and other expensive operations. This layer is where the intensive work on data is performed. These users then create Reflections (raw, aggregation, or both) from their views.
- In the fourth layer, users can create lightweight views for dashboards, reports, and visualization tools. They can also create aggregation Reflections to accelerate workloads as needed.
Querying Wide Tables
Dremio recommends these two best practices for querying wide tables:
- Create views for querying subsets of the leaf columns in wide tables.
Users who run ad hoc queries directly against wide tables might inadvertently create queries that need to scan more than 800 columns per table. To help users avoid failed queries, create views on subsets of the leaf columns in the wide table and give users access to those views. - Create Reflections to satisfy queries on wide tables.
It is best to restrict the leaf columns included in Reflections to those that are most frequently queried. Doing so conserves the resources that are required for storing and refreshing Reflections.
Querying a Dataset on Click
By default, the Query dataset on click setting is enabled. This means that when you click on a dataset, the SQL editor is opened on the SQL Runner page with a SELECT * FROM <dataset_name> statement, as shown in this image:

When querying or editing a dataset, a preview of the results will not render by default. The results will only load if you explicitly click Run or Preview.
If you would rather click directly on a dataset to see or edit the definition, see Preferences for modifying this setting.
When this setting is disabled, clicking on a dataset opens the SQL editor on the Datasets page with either a SELECT * FROM <dataset_name> statement or the definition of the dataset, depending on your dataset type and privileges. For more information, see Retrieving a Table Definition and Retrieving a View Definition.