Datasets
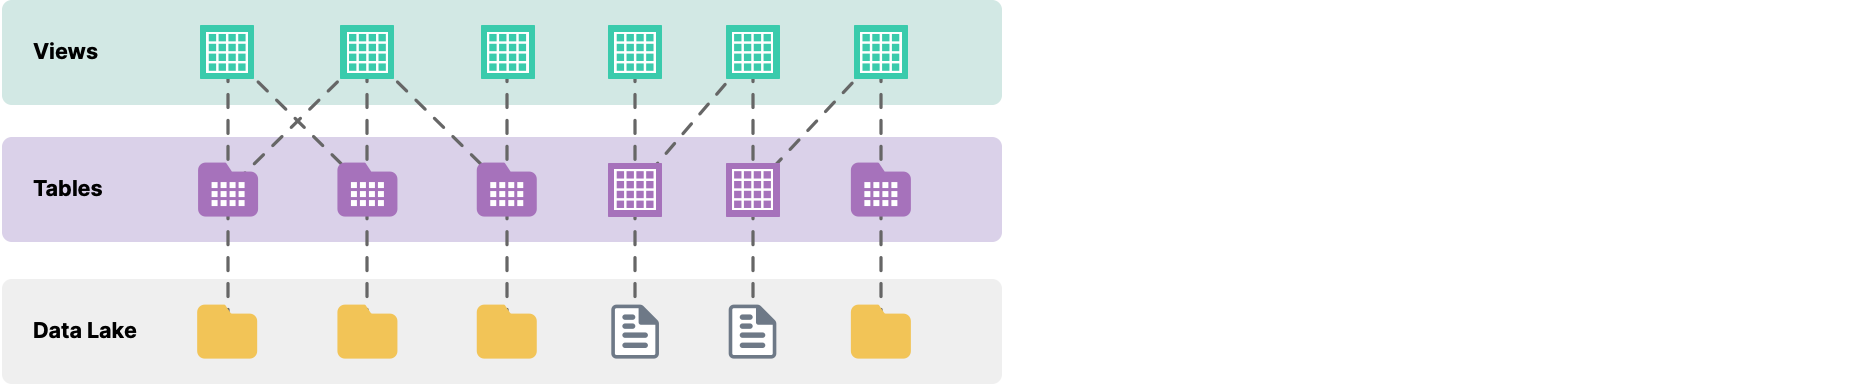
To analyze data from a data source, files must be formatted into tables in Dremio. You can then create views from one or more tables. The following figure shows how data is represented in Dremio.
Tables
A table contains the data from your source, formatted as rows and columns. A table cannot be modified by Dremio.
Tables created from a folder of files display as a folder  , whereas tables created from a single file are represented by a grid
  .
.
Formatting a Table
For formatting a file or folder as a table, see formatting tables and views.
Retrieving a Table Definition
Only for Nessie tables, you can retrieve the table definition, and in order to retrieve, you will need the SELECT privilege on the table. Because tables cannot be modified, you can't make edits to the table definition but you can retrieve the definition to understand where the table was derived from and to use it as a template for creating new views.
To see a table definition on the Datasets page, choose any one of these options:
Hover over the table name and click
 in the top right corner of the metadata card.
Hover over the line containing the table and click
on the right.Hover over the line containing the dataset, click
 on the right, and select Go to Table.
The table definition opens in the SQL editor.
If you want to use this table definition to create a view, see Creating a View.
If you have the SELECT privilege on a Nessie table, you can run SHOW CREATE TABLE <table_name> in the SQL editor to see the table definition. See SHOW CREATE TABLE.
Views
A view is a view derived from tables or other views. Views are defined by the steps necessary for their creation, including transformations, filters, joins, and other modifications.
Views are not copies of the data so they use very little memory and always reflect the current state of the parent tables or views they are derived from. A view is represented by ![]() .
.
Let's imagine a dataset is represented as a sales table. We can open this dataset within Dremio, and save it as a view called salesRaw. Later on we can derive another view called salesNY from salesRaw by excluding all data that doesn't originate from the state of New York. salesRaw and salesNY can each be queried and will return different results, but they are both based on the same underlying table.
Creating a View
You can create a view from an existing table or view by performing the following steps:
To create a view from a table, you can transform the data as required.
Compose the query as required and click Run to validate the query. After running the query, click the arrow next to Save Script As in the top right of the SQL editor, and select Save View as... from the drop-down menu.
Clicking Save View as... prompts you to name the new view and select from a list of spaces where it will be stored. Provide a name and select one space to store it. If the space (path) is not changed, the view gets saved in your home space.
To see the new view, navigate to the space that contains the view on the Datasets page. Click the view to see the data.
Example of Creating a View
This example shows how to create a view from the SF weather 2018-2019.csv table by performing the following steps:
On the Datasets page, trace the SF weather 2018-2019.csv table in the corresponding source folder and click it. To create a view, change the data type of the ELEVATION into a number by running the following query.
Query to change ELEVATION data typeSELECT TO_NUMBER(ELEVATION, '##.##') AS ELEVATION FROM "SF weather 2018-2019.csv"Click the arrow next to Save Script As in the top right of the SQL editor, and select Save View as... from the drop-down menu.
Clicking Save View as... prompts you to name the new view and select from a list of spaces where it will be stored. Provide a name and select a space to store it. Let us name the view as SFWeatherElevation. If you do not specify a space (path), the view is saved in your home space.
On the Datasets page, navigate to the space that contains the SFWeatherElevation view. Click the view to see the query and data. You can see the table with a single Elevation column and the following query.
Query for SFWeatherElevationSELECT * FROM SFWeatherElevation
Retrieving a View Definition
If you have the SELECT privilege for a view, you can see the underlying definition in the SQL editor but cannot edit the view directly.
To see a view definition on the Datasets page, choose any one of these options:
Hover over the view name and click
in the top right corner of the metadata card.Hover over the line containing the view and click
on the right.Hover over the line containing the view, click
on the right, and select Go to Dataset.
The view definition opens in the SQL editor.
If you want to use this definition to create another view, see Creating a View.
If you have the required privileges, you can run SHOW CREATE VIEW <view_name> in the SQL editor to see the view definition. See SHOW CREATE VIEW.
Editing a View
If you have the privileges required to edit a view, you can see and edit the definition of the view.
To edit a view, complete the following steps:
On the Datasets page, choose any one of these options:
Hover over the view name and click
 in the top right corner of the metadata card.
Hover over the line containing the view and click
on the right.Hover over the line containing the view, click
on the right, and select Edit.
The view definition opens in the SQL editor.
In the SQL editor, make changes to the view definition.
Click Save View in the top right corner of the SQL editor.
Viewing the Metadata of a Dataset
Wherever a dataset is referenced in Dremio, you can view a metadata card with details about the dataset.
To view the metadata, hover over a dataset to see a metadata card appear with details about the dataset. The components of the metadata card are described below.

| Location | Description |
|---|---|
| 1 | Icon represents the dataset format as a table |
| 2 | Card title displays the dataset name. |
| 3 | |
| 4 | Click |
| 5 | Click either |
| 6 | The path where the dataset is located. |
| 7 | Displays any labels that have been applied to the dataset. |
| 8 | Jobs: The number of jobs run on the dataset in the last 30 days, which links to the Jobs page. |
| 9 | Descendants: The number of views that are created from the dataset. |
| 10 | The date and time when the dataset was created. |
| 11 | The user who owns the dataset. |
| 12 | The date and time when the dataset was last updated. |
| 13 | Launch a BI tool to analyze your data. |
| 14 | Details Panel: Click this link to open the panel on the right side of the browser window. In the Details Panel, you can add or remove labels on the dataset and add or modify wiki content. |
| 15 | Lineage: Click this link to open the data lineage in a new tab. Lineage records how data got into the specific location and the intermediate steps and transformations that took place in its transit. |
| 16 | Columns: The number of columns in the dataset, including the name and data type of each column. Columns with partitions (if any) use a separate partition icon. |
When viewing a metadata card in the SQL Runner's data panel, the Columns section at the bottom of the card is not displayed because columns can be displayed by expanding the dataset.
Layering Tables and Views
Dremio recommends that, when you create tables and views, you create them in layers:
- The bottom or first layer consists of your tables.
- In the second layer are views, one for each table, that do lightweight preparation of data for views in the next layers. Here, administrators might create views that do limited casting, type conversion, and field renaming, and redacting sensitive information, among other prepping operations. Administrators can also add security by subsetting both rows and fields that users in other layers are not allowed to access. The data has been lightly scrubbed and restricted to the group of people who have the business knowledge that lets them use these views to build higher-order views that data consumers can use. Then, admins grant access to these views to users who create views in the next layer, without being able to see the raw data in the tables.
- In the third layer, users create views that perform joins and other expensive operations. This layer is where the intensive work on data is performed. These users then create reflections (raw, aggregation, or both) from their views.
- In the fourth layer, users can create lightweight views for dashboards, reports, and visualization tools. They can also create aggregation reflections, as needed.
Exploring Datasets
When viewing or editing a dataset, you are directed to the Data tab by default. For more options, check out the other tabs on the Datasets page:

| Location | Description |
|---|---|
| 1 | Details shows the columns in a dataset and lets you add information about a specific dataset in its wiki. You can add searchable labels, which enhances team collaboration because other users can search the labels to trace a specific dataset. |
| 2 | Lineage is a graph of the dataset, showing its data source, parent datasets, and children datasets. |
| 3 | Reflections are physically optimized representations of source data. |
Lineage
Lineage provides a graph of a dataset with its parent and child datasets.
On the Lineage tab, click ![]() to refocus the graph of the dataset at any time.
to refocus the graph of the dataset at any time.
If you have the SELECT privilege on the parent datasets and the child datasets, you can see the parent datasets, together with data sources, on the left. The child datasets appear on the right. The full metadata about the parents and children is also visible, as shown in this image:

If you have only the READ METADATA privilege on the parent and child datasets, then you can see only limited metadata about them.
If you do not have the SELECT or the READ METADATA privilege on the parent and child datasets, they are not visible.
Chaining Datasets
There are a few considerations when chaining datasets:
- If a column that is used in the child dataset (either direct column reference or
select *) is dropped from the parent dataset, the child dataset must be updated. It is invalid until this is corrected. - If a column is added to a parent dataset, it does not show up in the child dataset (even when using
select *) until it is updated.
Starring a Table or View
You can star a table or view that you use frequently, which adds the table or view to your Starred list for easier access.
To star a table or view:
- Click on the
 icon in the side navigation bar to navigate to the SQL Runner.
 - In the Data panel, find the dataset.
- Click on the
 icon that appears next to the dataset. The dataset will appear on your Starred list.
In addition to starring tables and views, you can star spaces, sources, and other objects in the data catalog. The Starred list can hold up to 25 entities at a time, and each starred item remains on the list even if you open a new browser or clear the cache. To unstar a catalog object, click the Star icon again.
- The starring option is not available for datasets in the Nessie repository.
- Starring is different from pinning items. You can only pin spaces and sources on the Datasets page, and pinned items are not saved if you open a new browser or clear the cache.
Removing a Table
Removing the formatting on a table will revert the table to the folder or file format that it was originally in. For the steps, see Removing Formatting on Data.
Removing a View
Perform the following steps to remove a view:
On the Datasets page, go to the Home Space
 icon or any space under Spaces, where your view is located.
Under the Action column of a view that you want to remove, click the ellipses (...) icon. From the list of actions, click Remove. Confirm that you want to remove the view.
If you are removing a table or view with children, you get a warning. Removing a table or view with children leaves you with disconnected views that you can no longer query.
Querying a Dataset on Click
By default, the Query dataset on click setting is enabled. This means that when you click on a dataset, the SQL editor is opened on the SQL Runner page with a SELECT * FROM <dataset_name> statement, as shown in this image:

When querying or editing a dataset, a preview of the results will not render by default. The results will only load if you explicitly click Run or Preview.
If you would rather click directly on a dataset to see or edit the definition, see Preferences for modifying this setting.
When this setting is disabled, clicking on a dataset opens the SQL editor on the Datasets page with either a SELECT * FROM <dataset_name> statement or the definition of the dataset, depending on your dataset type and privileges. For more information, see Retrieving a Table Definition and Retrieving a View Definition.