Get Started with the Enterprise Edition Free Trial
This Get Started guide walks you through deploying Dremio on Kubernetes using a free trial of the Enterprise Edition, exploring the multiple features available in this edition. For more information, see How Does the Enterprise Edition Free Trial Work.
Prerequisites
Before deploying Dremio on Kubernetes, ensure you have the following:
- A hosted Kubernetes environment to deploy and manage the Dremio cluster.
Each Dremio release is tested against Amazon Elastic Kubernetes Service (EKS), Azure Kubernetes Service (AKS), and Google Kubernetes Engine (GKE) to ensure compatibility. If you have a containerization platform built on top of Kubernetes that is not listed here, please contact your provider and the Dremio Account Team regarding compatibility. - Helm 3 installed on your local machine to run Helm commands. For installation instructions, refer to Installing Helm in the Helm documentation.
- A local kubectl configured to access your Kubernetes cluster. For installation instructions, refer to kubectl in the Kubernetes documentation.
- Object Storage: Amazon S3 (including S3-compatible, e.g., MinIO), Azure Storage, or Google Cloud Storage (GCS).
Step 1: Deploy Dremio
Let's start by deploying the Enterprise Edition on your hosted Kubernetes environment:
-
If you haven't already, sign up for the Enterprise Edition Free Trial.
-
In the email you receive from Dremio, click a link to download the
values-overrides.yamlfile containing the deployment information and save the file locally. -
Open the
values-overrides.yamlfile in an editor to make the following configurations:- For distributed storage, follow the instructions in Configuring the Distributed Storage, and then return here.
- For object storage, follow the instructions in Configuring Storage for the Open Catalog, and then return here.
- (Optional) For the coordinator, you can adjust its default values by following the instructions in Recommended Resources Configuration, and then return here.
- Save the
values-overrides.yamlfile.
-
Open a terminal window, and start the deployment by installing Dremio's Helm chart with the following command:
Run helm installhelm install <your-dremio-install-release> \
oci://quay.io/dremio/dremio-helm \
-f <your-local-path>/values-overrides.yamlWhere:
<your-dremio-install-release>- The name that identifies your Dremio installation. For example,dremio-1-0.<your-local-path>- The path to reach thevalues-overrides.yamlfile.
-
Monitor the deployment using the following command:
Run kubectl to monitor podskubectl get pods
The deployment is complete when all pods are in the Ready state.
Now, access the Dremio console to interact with the platform in a user-friendly and visual way. It is a key component of the Dremio experience and is accessible through a web browser:
-
Run the following command in Kubernetes to find the host for the Dremio console:
Run kubectl to find the Dremio consolekubectl get services dremio-client -
Depending on the value in the
TYPEcolumn of the output, open the Dremio console in your browser with one of the following URLs:- https://EXTERNAL_IP:9047 - If the value in the
TYPEcolumn isLoadBalancer, use the value from theEXTERNAL_IPcolumn of the output in the URL. For example,https://8.8.8.8:9047. - http://localhost:32390 - If the value in the
TYPEcolumn isNodePort.
- https://EXTERNAL_IP:9047 - If the value in the
-
Follow the instructions, and enter your details.
You should have the Dremio console ready in your browser.
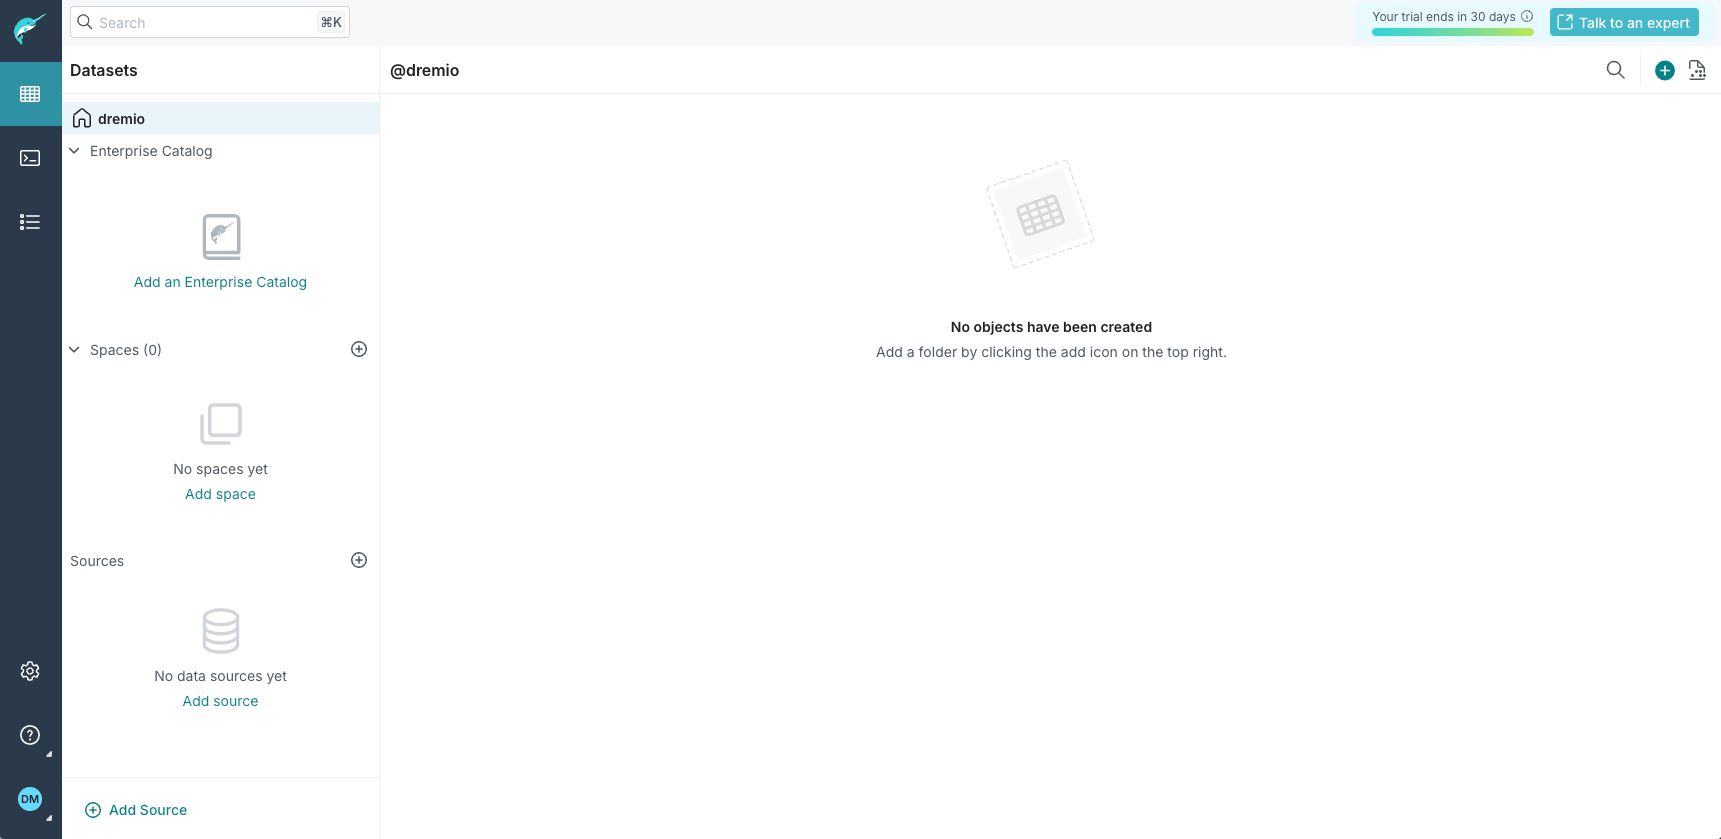
To learn how to navigate the Dremio console, see Quick Tour of the Dremio Console.
Step 2: Create an Engine
Engines are responsible for query execution. Each engine comprises one or more executors that perform queries and Data Manipulation Language (DML) operations by running the query execution plan and transiting data between themselves to serve queries.
To create an engine, do the following:
- Click
 in the side navigation bar to go to the Settings page.
 - Select Engines from the settings sidebar, and then click Add Engine on the far right.
- In the New Engine dialog, enter a name for your engine. For example,
my-engine. - Click Add.
You will see a new line with your engine with the Status as Starting.
Wait until the Status changes to Running for the engine to be available to serve your queries.
The engine you created is configured to automatically stop/start. This means that Dremio automatically stops the engine after 15 minutes of idle time to save resources. When a new query is issued, Dremio automatically starts the engine, but your query may take a bit longer to execute while the engine starts.
If you want to have the engine always running, edit the engine and uncheck the Automatically start/stop option.
Step 3: Add the Sample Data
Let's add the sample datasets that will be used in this Get Started guide, namely:
- NYC taxi trip data – In Iceberg format, with more than 338 million records.
- NYC weather data – In CSV format, with more than 4 thousand records.
Add the Datasets
Add the datasets from a sample data source, as follows:
- In the Dremio console, click
 in the side navigation bar to go to the Datasets page.
 - Click
 right next to Sources.
 - In the Add Source dialog, select
Sample Sourcein the Object Storage section.
Format the Datasets
Now that the data source has been added, let's format the needed datasets as tables so that we can query them:
- Under Object Storage, click the newly added
Samplessource, and thensamples.dremio.comto see its details. - Hover over the
NYC-taxi-trips-icebergfolder, and click on the far right.
 - In the Folder Settings dialog, check the Format, verify that
Icebergis detected, and click Save. - Click
 in the side navigation bar, click the
 Samplessource, and thensamples.dremio.comto see its details. - Hover over the
NYC-weather.csvfile, and click on the far right.
 - In the Table Settings dialog, do the following:
- For Line Delimiter, select
LF - Unix/Linux. - Under Options, check Extract Column Names.
- Click Save.
- For Line Delimiter, select
The sample data is now added, formatted, and ready to be queried.
You can validate it by clicking ![]() in the side navigation bar, then the
in the side navigation bar, then the Samples source, and then samples.dremio.com to see its details:
- The icon for
NYC-taxi-trips-icebergis , which means the folder is formatted as a table.
 - The icon for
NYC-weather.csvis , which means the file is formatted as a table.
Step 4: Create a Data Product
In this step, you will start creating a data product to explore the relationship between weather conditions and tipping behavior in taxi rides to answer the business question: "Do people tip more during taxi rides when it's raining?".
Run the Query for the Data Product
To answer the business question, you will need the average tip amount per precipitation level. For that, combine the data in the NYC-taxi-trips-iceberg and NYC-weather.csv datasets on a common field: the date.
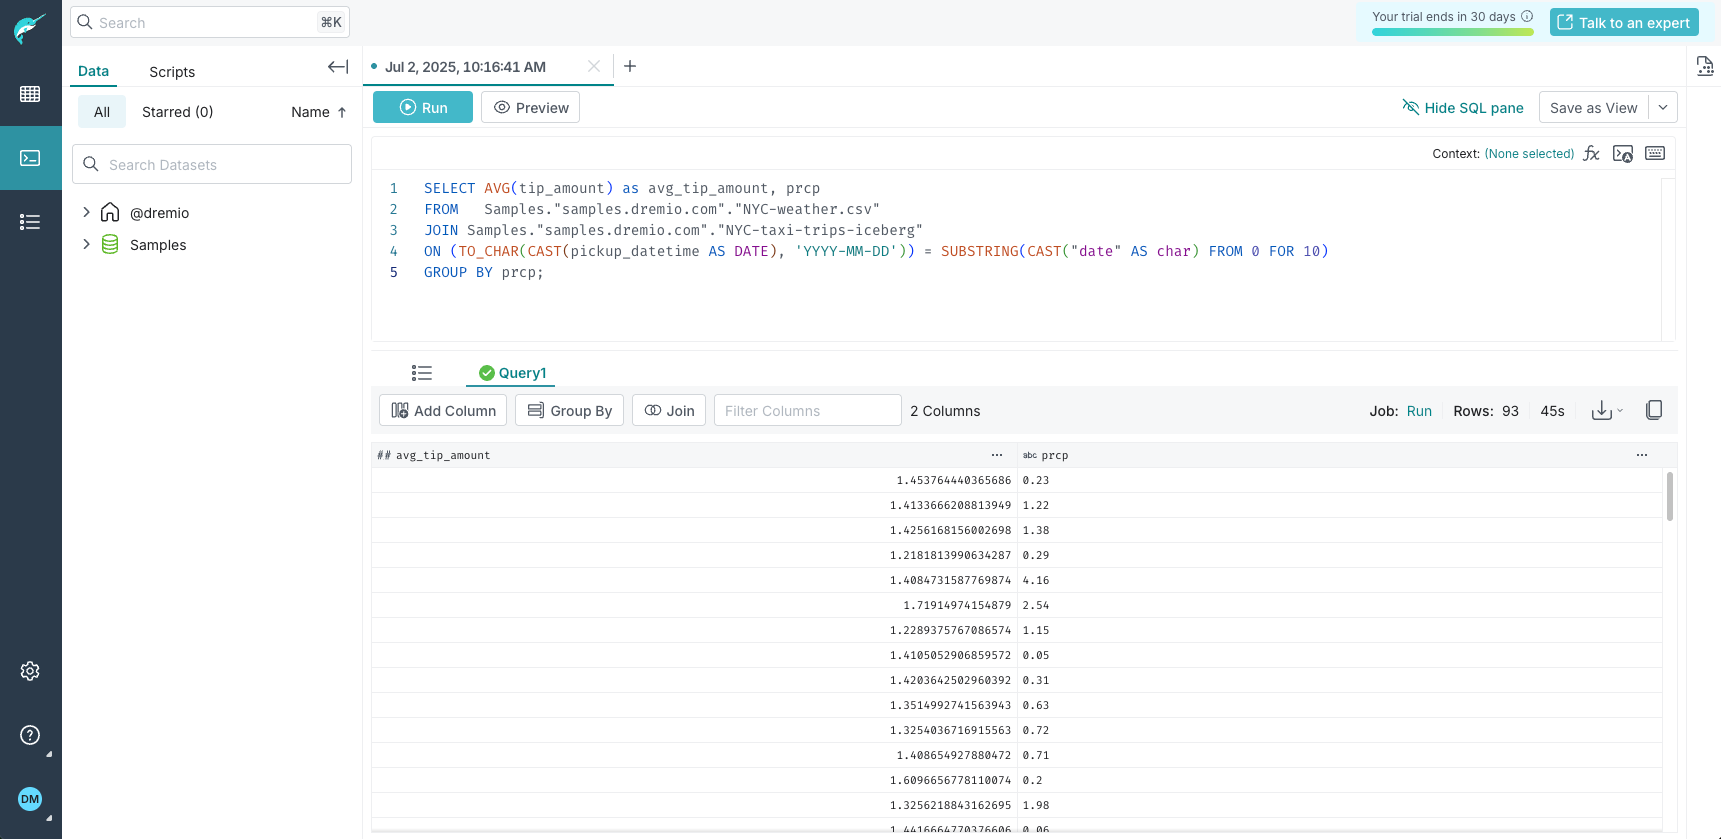
To do this, run the SQL query that joins the two datasets, and calculates the average tip amount per precipitation level:
-
Click
 in the side navigation bar to go to the SQL Runner.
 -
Copy the SQL below, paste it in the SQL Runner, and click Run.
SQL to join datasetsSELECT AVG(tip_amount) as avg_tip_amount, prcp
FROM Samples."samples.dremio.com"."NYC-weather.csv"
JOIN Samples."samples.dremio.com"."NYC-taxi-trips-iceberg"
ON (TO_CHAR(CAST(pickup_datetime AS DATE), 'YYYY-MM-DD')) = SUBSTRING(CAST("date" AS CHAR) FROM 0 FOR 10)
GROUP BY prcp;
You will get the query results, as shown in the image below.
Create the View for the Data Product
In Dremio, views are virtual tables based on the result set of a query. You can create views from data that resides in any data source, folder, table, or view that you have access to. You can also share views you've created with stakeholders in your organization.
Let's create a view for the data product from the query that you ran above:
- Click Save as View on the far right to create a view of your query that others can access.
- In the Save View As dialog, enter a name for your view. For example,
avg_tips_precipitation. - Click Save.
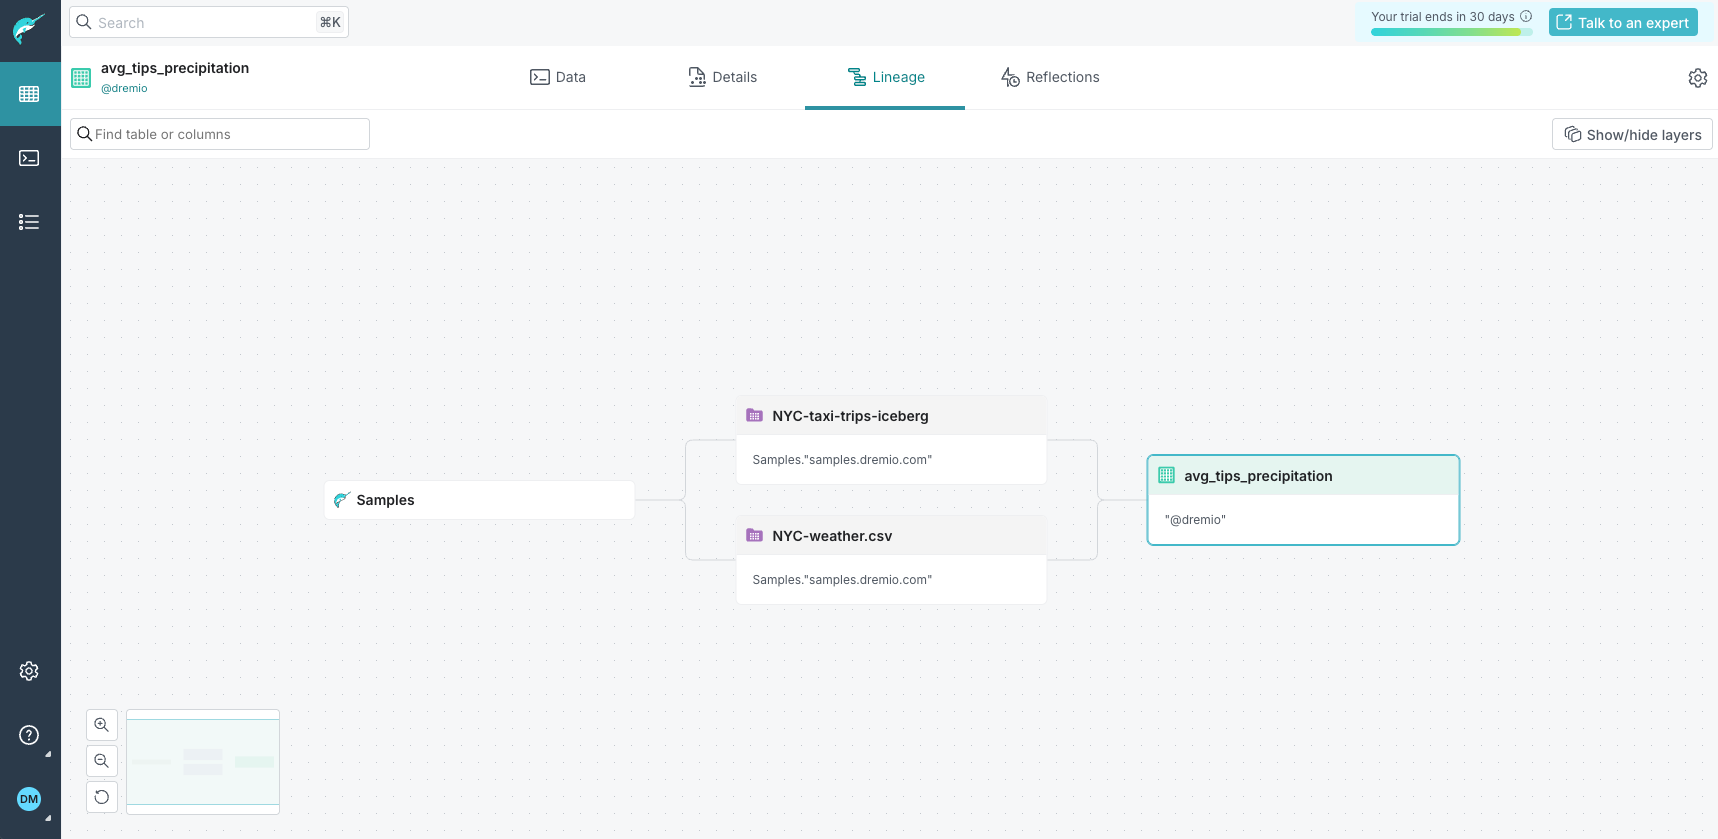
You can see the lineage of your datasets in a graph showing all the relationships with end-to-end visibility into how data is sourced and transformed, which helps you understand the data flow and dependencies between datasets.
For your newly created view, see the lineage by selecting the Lineage tab at the top of the page:
Step 5: Accelerate the Query with Reflections
In this step, you will use Reflections to accelerate queries, particularly when working with large datasets.
Enable the Reflection
Let's enable a Raw Reflection to accelerate the query of your view:
-
Select the Reflections tab at the top of the page, toggle the Raw Reflections switch to on, and click Save.
-
On the far right, you will see an animated spinner icon close to Footprint. Wait until it turns into a green checkmark, which means that your query has been accelerated.
Run the Accelerated Query
Let's now query the view and see the acceleration in action:
-
Click
 , click
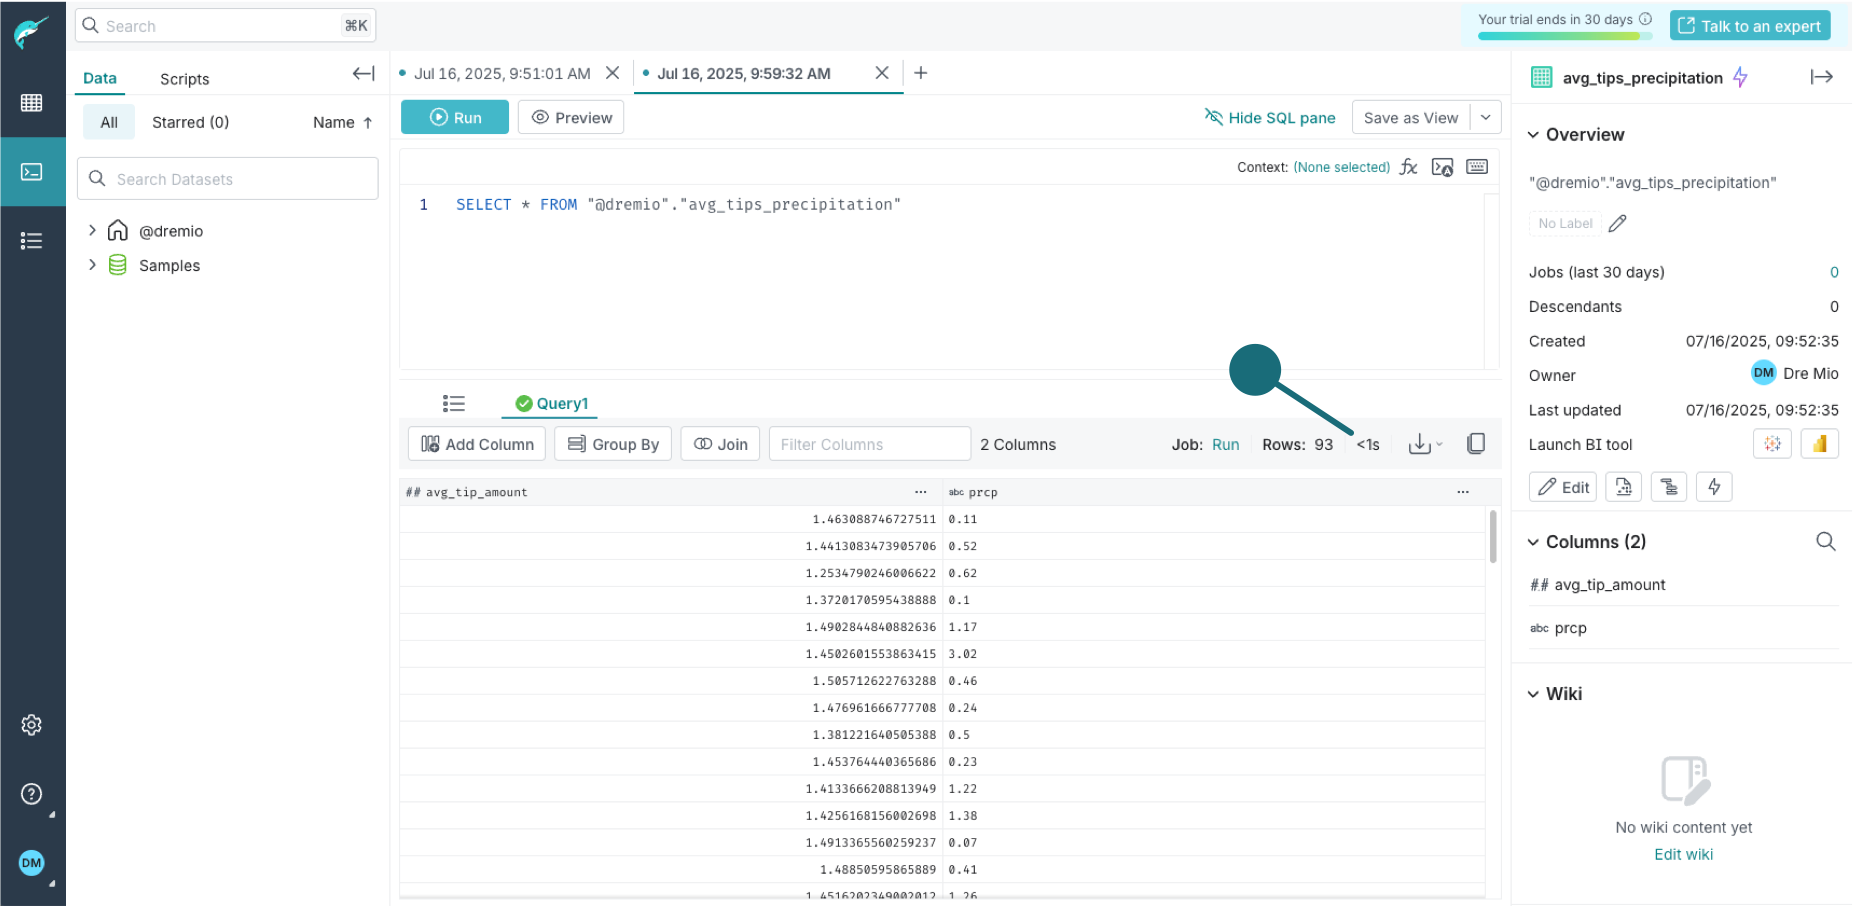
 avg_tips_precipitation, and click Run to execute the query. -
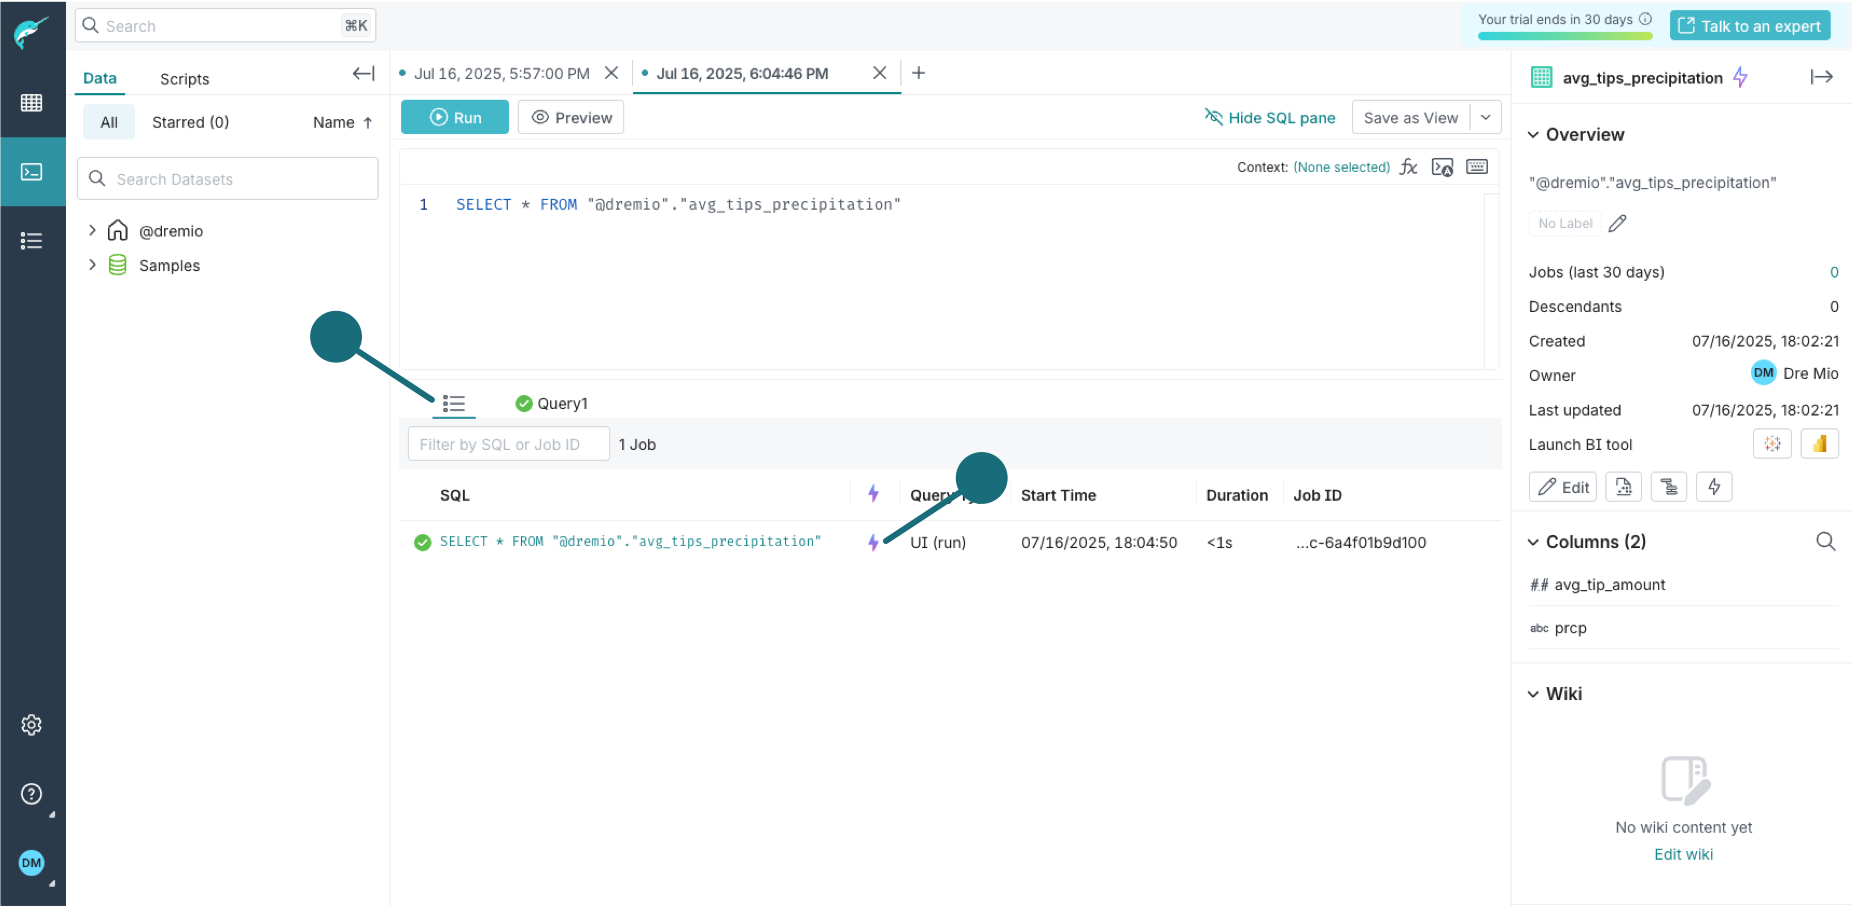
Check the execution time. It's a sub-second query!
-
Now, go to the Jobs tab, and confirm that the query was accelerated with a Reflection.
You’ve just created a Raw Reflection and accelerated your query!
While creating a Reflection manually is a great way to understand how Dremio boosts performance, you don’t need to manage this complexity yourself in real-world environments if you use Autonomous Reflections — available exclusively in the Enterprise Edition. Dremio will automatically create, select, and maintain the most efficient Reflections for you, saving time while ensuring consistently fast performance of your queries.
And that's it! You finished the Get Started guide for the Enterprise Edition free trial.
Explore the documentation to learn more about Dremio, start using your data, build your data products, connect your client applications, and much more.