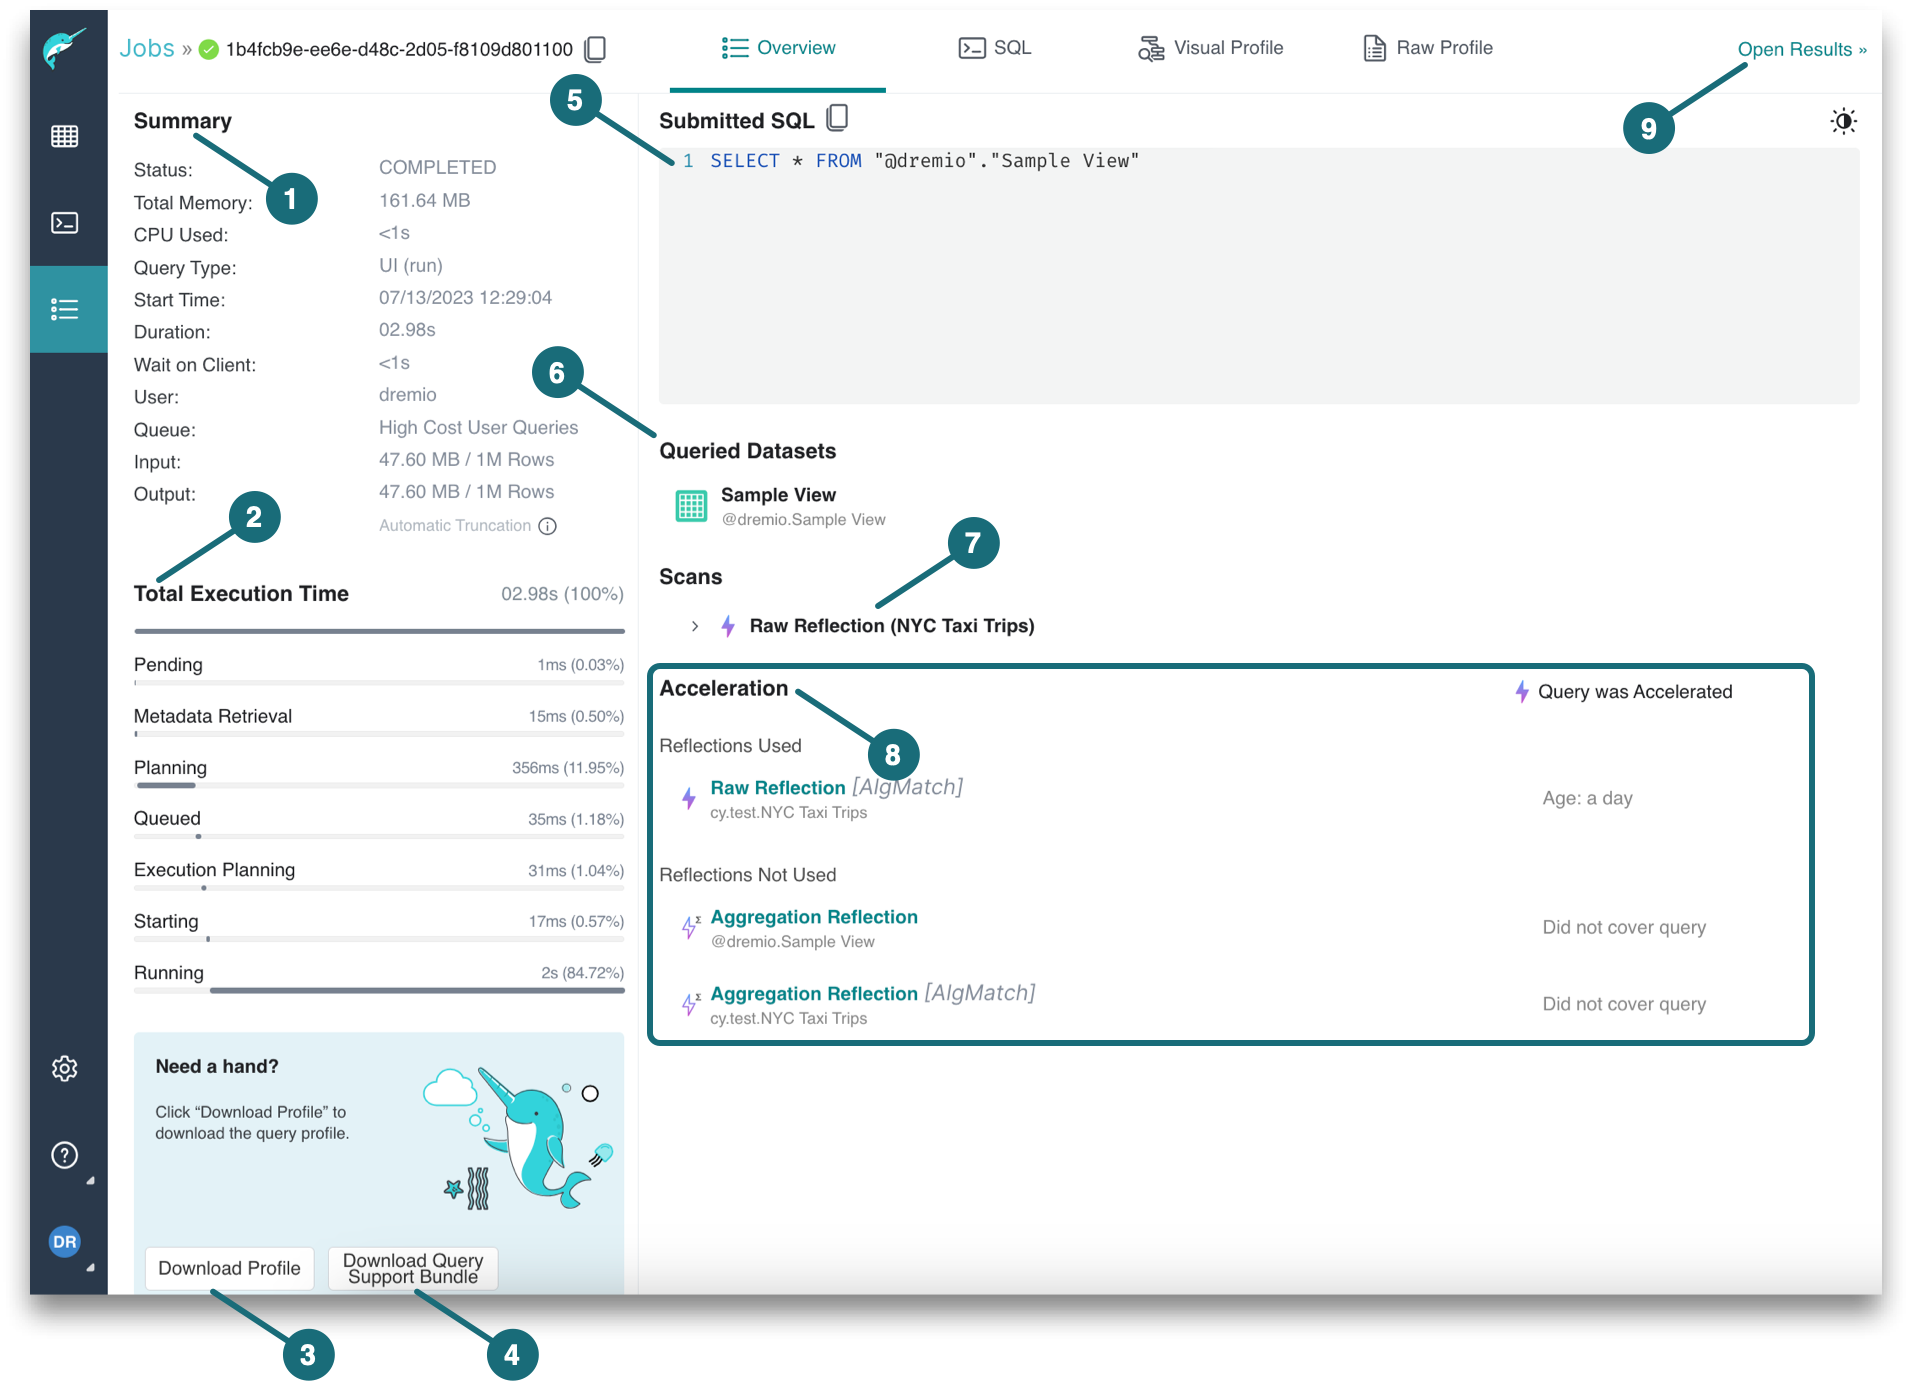
Viewing a Job Overview
You can view the details of a specific job on the Job Details page.
To navigate to a job overview:
- Click
 in the side navigation bar.
 - On the Jobs page, click a job that you would like to see the job overview for. The Job Details page then replaces the list of jobs.
The main components of the Job Details page are numbered below:

1. Summary
Each job is summarized by the following information:
| Attribute | Description |
|---|---|
| Status | Represents one or more job states. For descriptions, see Job States and Statuses. |
| Total Memory | Provides statistics about the actual cost of the query operations in terms of memory. |
| CPU Used | Provides statistics about the actual cost of the query operations in terms of CPU processing. |
| Query Type | Represents one of the five query types: Accelerator, Downloads, External Tools, Internal, and UI. For descriptions, see Query Types in Job Attributes. |
| Start Time | The date and time which the job began. |
| Duration | The length of time (in seconds) that a job required from start to completion. |
| Wait on Client | The length of time (in seconds) that is waiting on the client. |
| User | Username of the user who ran the query and initiated the job. |
| Queue | Defined by memory limits and CPU priority, or other specific characteristics to which queries can be assigned. For descriptions, see Queues. |
| Input | The number of bytes and the number of rows considered for the job. |
| Output | The number of bytes and the number of rows resulted as output from the job. |
2. Total Execution Time
The total execution time is the length of time for the total execution and the job state durations in the order they occur. Only the duration of the Engine Start state is in minutes and seconds. If the engine is stopped, it takes time to restart for the executors to be active. If the engine is already started, then Engine Start duration does not have a value. For descriptions, see Job States and Statuses.
3. Download Profile
To download the query profile, click the Download Profile button in the bottom-left corner of the Job Details page. The profile will help you see more granular details about the job.
The profile downloads as a ZIP file. When you extract the ZIP file, you will see the following JSON files:
- profile_attempt_0.json -- This file helps with troubleshooting out of memory and wrong results issues. Note that the start and end time of query is provided in EPOCH format. See the Epoch Converter utility for converting query time.
- header.json -- This file provides the full list of Dremio coordinators and executors, data sets, and sources. This information is useful when you are using REST calls.
You can export profiles using the Admin CLI utility. See Export Profiles for more information.
4. Download Query Support Bundle
The Generate Query Support Bundle button appears only on YARN-based Dremio deployments.
5. Submitted SQL
The SQL query for the selected job.
6. Queried Datasets
The datasets queried for the selected job. These can be views or tables.
7. Scans
Scan details include the source type, scan thread count, IO wait time (in milliseconds), and the number of rows scanned.
8. Acceleration
Only if the job was accelerated, the Acceleration section appears and Reflections data is provided. See Reflections for more information.
9. Results
To see the job results, click the Open Results link in the top-right corner of the Job Details page. As long as the engine that ran the job is up, the Open Results link is visible in the UI. It disappears when the engine that ran the job shuts down and is only visible for the jobs that are run through the UI.