Viewing Jobs
All jobs run in Dremio are listed on a separate page, showing the job ID, type, status, and other attributes.
To navigate to the Jobs page, click ![]() in the side navigation bar.
in the side navigation bar.
Search Filters and Columns
By default, the Jobs page lists the jobs run within the last 30 days and the jobs are filtered by UI, External Tools job types. To change these defaults for your account, you can filter on values and manage columns directly on the Jobs page, as shown in this image:

a. Search Jobs by typing the username or job ID.
b. Start Time allows you to pick the date and time at which the job began.
c. Status represents one or more job states. For descriptions, see Job States and Statuses.
d. Type includes Accelerator, Downloads, External Tools, Internal, and UI. For descriptions, see Query Types in the Job Attributes.
e. User can be searched by typing the username or checking the box next to the username in the dropdown.
f. Manage Columns by checking the boxes next to additional columns that you want to see in the Jobs list. The grayed out checkboxes show the columns that are required by default. You can also rearrange the column order by clicking directly on a column to drag and drop.
Job Attributes
Each job has the following attributes, which can appear as columns in the list of jobs:
| Attribute | Description |
|---|---|
| Accelerated | A lightning bolt icon in a row indicates that the job ran a query that was accelerated. |
| Dataset | The dataset queried, if one was queried. |
| Duration | The length of time (in seconds) that a job required from start to completion. |
| Job ID | A universally unique identifier. |
| Planner Cost Estimate | A cost estimate calculated by Dremio based on an evaluation of the resources that to be used in the execution of a query. The number is not in units, and is intended to give a an idea of the cost of executing a query relative to the costs of executing other queries. Values are derived by adding weighted estimates of required I/O, memory, and CPU load. In reported values, K = thousand, M = million, B = billion, and T = trillion. For example, a value of 12,543,765,321 is reported as 12.5B. |
| Planning Time | The length of time (in seconds) in which the query optimizer planned the execution of the query. |
| Query Type | Represents one of the five query types:
|
| Queue | Dremio provides the following generic queues as a starting point for customization:
|
| Rows Returned | Number of output records. |
| Rows Scanned | Number of input records. |
| SQL | The SQL query that was submitted for the job. |
| Start Time | The date and time which the job began. |
| Status | An icon that represents one or more job states. This column is automatically shown at the start of each row. For descriptions, see Job states and statuses. |
| User | Username of the user who ran the query and initiated the job. |
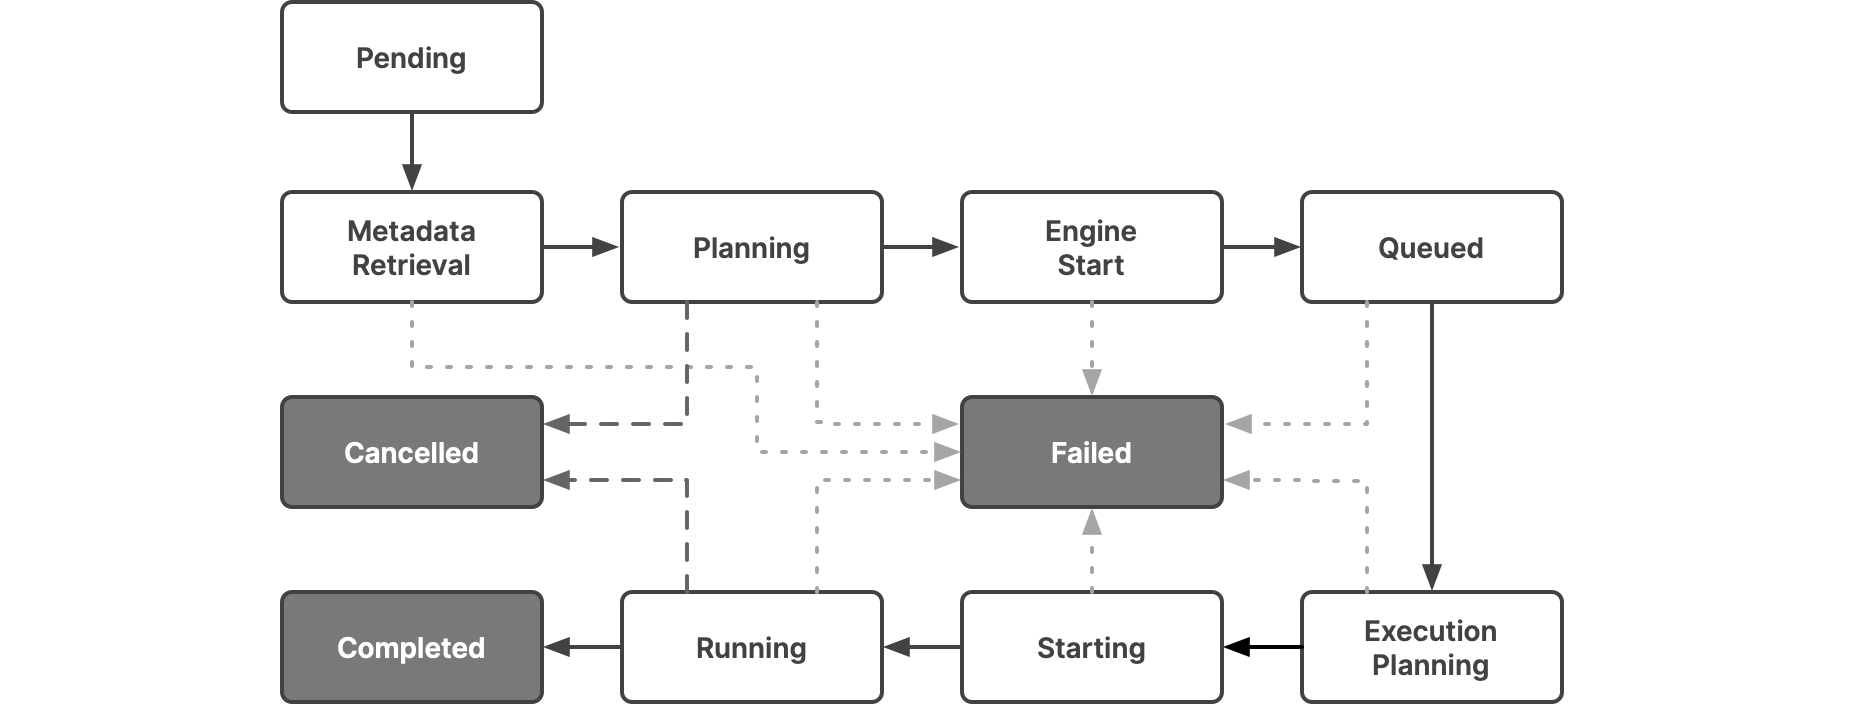
Job States and Statuses
Each job passes through a sequence of states until it is complete, though the sequence can be interrupted if a query is canceled or if there is an error during a state. In this diagram, the states that a job passes through are in white, and the possible end states are in dark gray.
This table lists the statuses that the UI lets you filter on and shows how they map to the states:
| Icon | Status | State | Description |
|---|---|---|---|
| Setup | Pending | Represents a state where the query is waiting to be scheduled on the query pool. | |
| Metadata Retrieval | Represents a state where metadata schema is retrieved and the SQL command is parsed. | ||
| Planning | Represents a state where the following are done:
| ||
| Engine Start | Engine Start | Represents a state where the engine starts if it has stopped. If the engine is stopped, it takes time to restart for the executors to be active. If the engine is already started, then this state does not have a duration. | |
| Queued | Queued | Represents a state where a job is queued. Each queue has a limit of concurrent queries. If the queries in progress exceed the concurrency limit, the query should wait in the queue until the jobs in progress complete. | |
| Running | Execution Planning | Represents a state where executor nodes are selected from the chosen engine to run the query, and work is distributed to each executor. | |
| Running | Represents a state where executor nodes execute and complete the fragments assigned to them. Typically, most queries spend more time in this state. | ||
| Starting | Represents a state where the query is starting up. | ||
| Canceled | Canceled | Represents a terminal state that indicates that the query is canceled by the user or an intervention in the system. | |
| Completed | Completed | Represents a terminal state that indicates that the query is successfully completed. | |
| Failed | Failed | Represents a terminal state that indicates that the query has failed due to an error. |