Pillar 6 - Self-Service Semantic Layer
The semantic layer is a data management level that transforms the datasets from your data sources into a format that data consumers can use in their applications.
You will find that Dremio already provides a semantic layer for you to build upon. By default, each user has a home space where they can create a hierarchy of folders and add more spaces. Connected sources and datasets from those sources appear in your data catalog. Icons, too, appear next to each data object to show if it is a table, view, space, or source. However, this is only a starting point.
Dremio has a unique capability in its semantic layer, where the physical structure of the underlying data storage is mapped to how the data is consumed ultimately via SQL queries. When the semantic layer is optimally designed and maintained, the data is easy to discover, queries are easy to write, and performance is optimized.
As more users from your organization use Dremio and create more data objects, it will be much easier to navigate and manage your data if you establish the proper processes and structures. In order to further categorize and organize these data objects, we have compiled a list of best practices in this guide for building your semantic layer.
Before starting this guide, think about:
- What are the different use cases for Dremio in your organization?
- What types of users will be accessing the semantic layer?
- Have you enabled security roles and assigned them to your users?
- Do you have a list of common terms used by your organization?
If you feel that you have enough information to start building your semantic layer, see the following recommended best practices for ways to make this self-service layer the most effective and efficient for your organization.
Principles
Manage Your Data Catalog
Within the semantic layer is a data catalog consisting of spaces, folders, tables, and views. By having an indexed, searchable data catalog, users can query and edit datasets, maintain workspaces, and derive new views.
To help manage this data catalog, the data panel shows the hierarchy of data objects and how they relate to each other. Use this data panel to create, modify, or remove data objects in your catalog. The data catalog is also used when setting the context of data objects in the SQL editor, ensuring that the query is referencing a specific data object from a source, space, or folder.
Organize Environments and Spaces
We recommend having distinct environments for development, quality assurance, and production. If you only have a single environment for building your semantic layer, you can use spaces instead to separate your resources.
Within each environment, use your data panel to create spaces. Spaces let you group datasets by common themes such as a project, purpose, department, or geographic region. See example below:

In this example, the production environment contains four spaces: Engineering, IT, Marketing, and Sales. We can then choose whether to create folders in each space as sub-layers, such as dividing Sales by region and creating folders for Sales-US, Sales-EMEA, and Sales-APAC. Within those folders, you can create more sub-layers and so on.
Layer Views
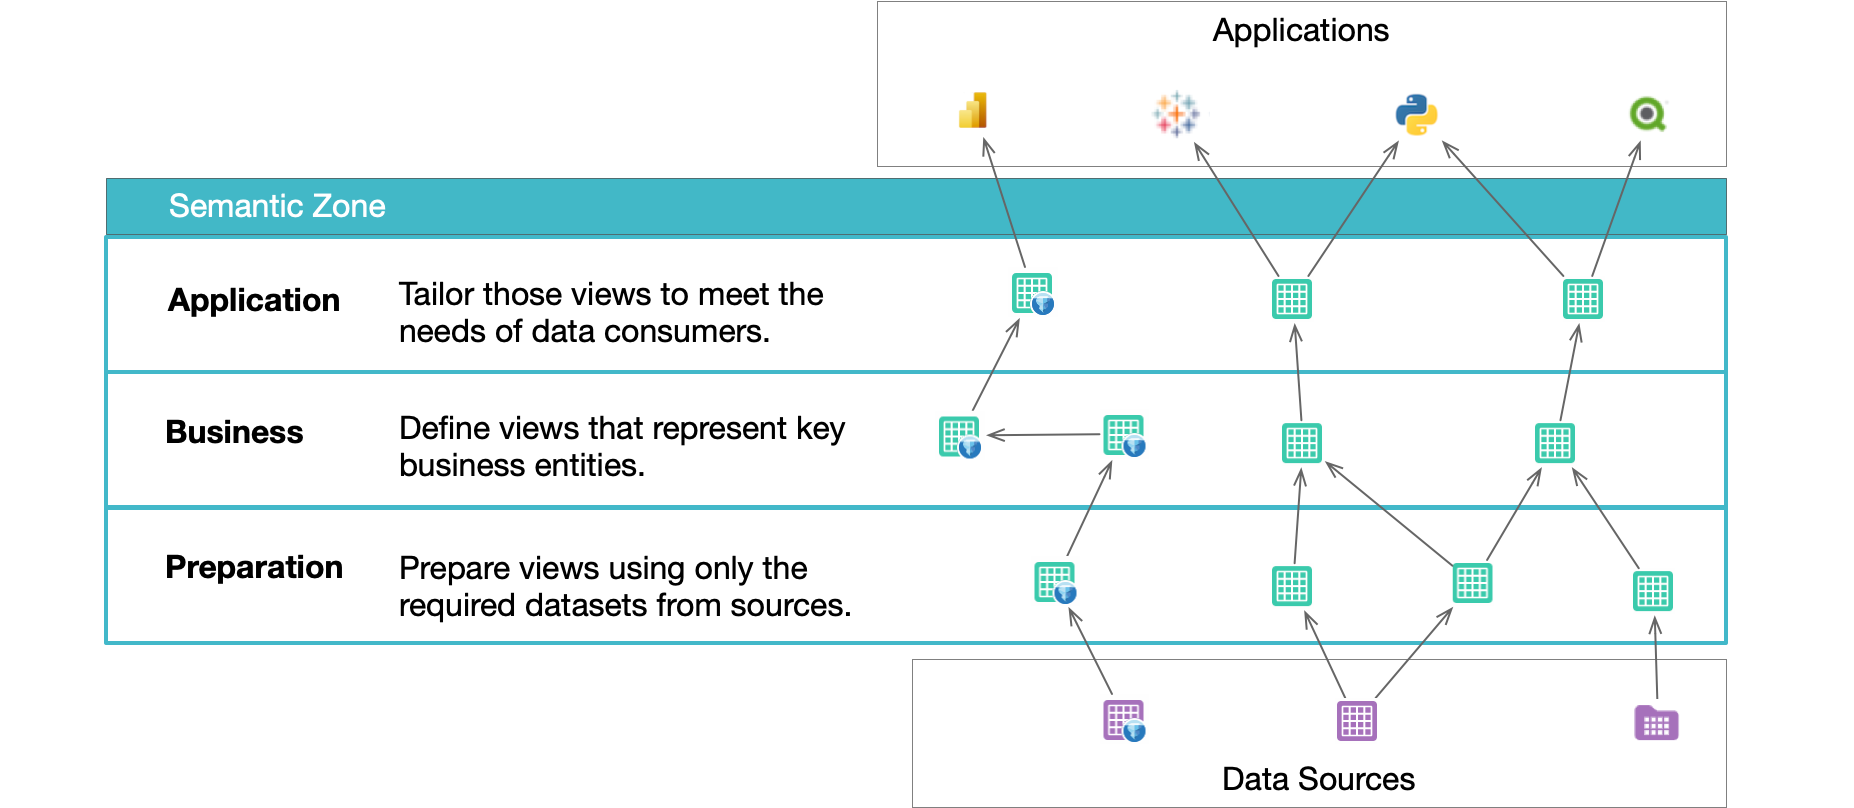
When you create sets of views in the semantic layer, we recommend organizing them into sub-layers so that they can be used many times across multiple projects, providing agility to development teams and users. This practice is called layering your views.
By layering your views, you can balance security, performance, and usability, because layered views will help you take the data in your physical tables and expose it to external consumption tools in the format they require, properly secure it, and address performance.
You can create sub-layers by organizing your views into three folders: Preparation, Business, and Application. These folders can be created within your designated spaces or folders, depending on how you want to build your semantic layer.
Below you can see how the layer concepts can be mapped to a coherent space and folder structure inside your project:

Refer to the diagram below for the following descriptions of each sub-layer.

Annotate Datasets to Enhance Discovery and Understanding
Datasets can be tagged and documented in Dremio, allowing data to be more easily discovered. The data's veracity can be verified, and governance can be applied.
Best Practices
Use the Preparation Layer for 1:1 Mapping to Tables
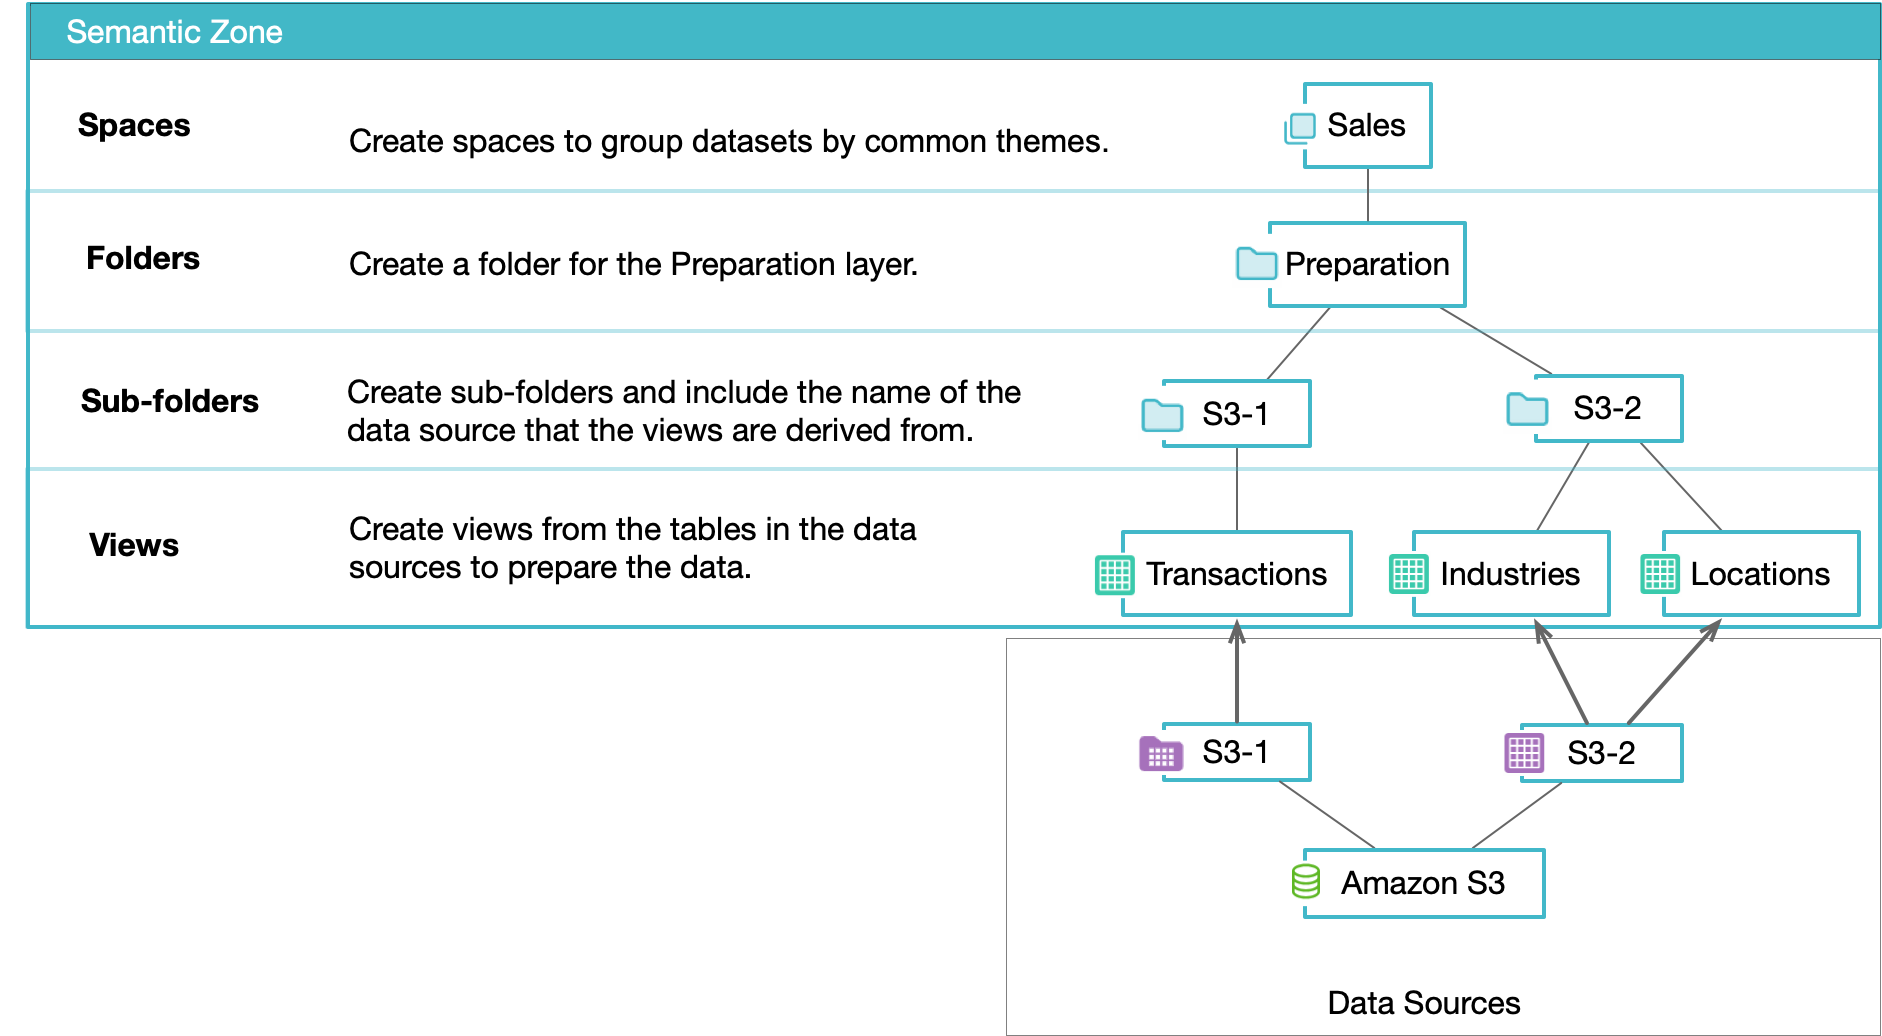
The Preparation layer is closest to the data sources. This layer is used to organize and expose only the required datasets from a source rather than all datasets in a source. In this layer, each view is mapped to the table from which it is derived in the data source, and there are no joins to other views.
Typically, a data engineer is responsible for preparing the data in this layer. In the Preparation layer, the data engineer should apply column aliasing so that all downstream views can use the normalized column names. Casting of column data types should be done in the Preparation layer so that all higher level views can leverage the correct type, and the conversion is done only once. Data should be cleansed in the Preparation layer so that it is centrally managed and all downstream views can used clean data. When derived columns based on existing columns are required, this should be done in the Preparation layer, thus enabling all future layers to use the new columns.
We also recommend dividing this layer into sub-folders, and for each sub-folder, include the name of the data source that the views are derived from. See the diagram below for an example of the Preparation layer:

Within the Sales space, there is a Preparation folder to contain all views related to sales that have been prepared from the S3-1 and S3-2 tables.
Use the Business Layer to Logically Join Datasets
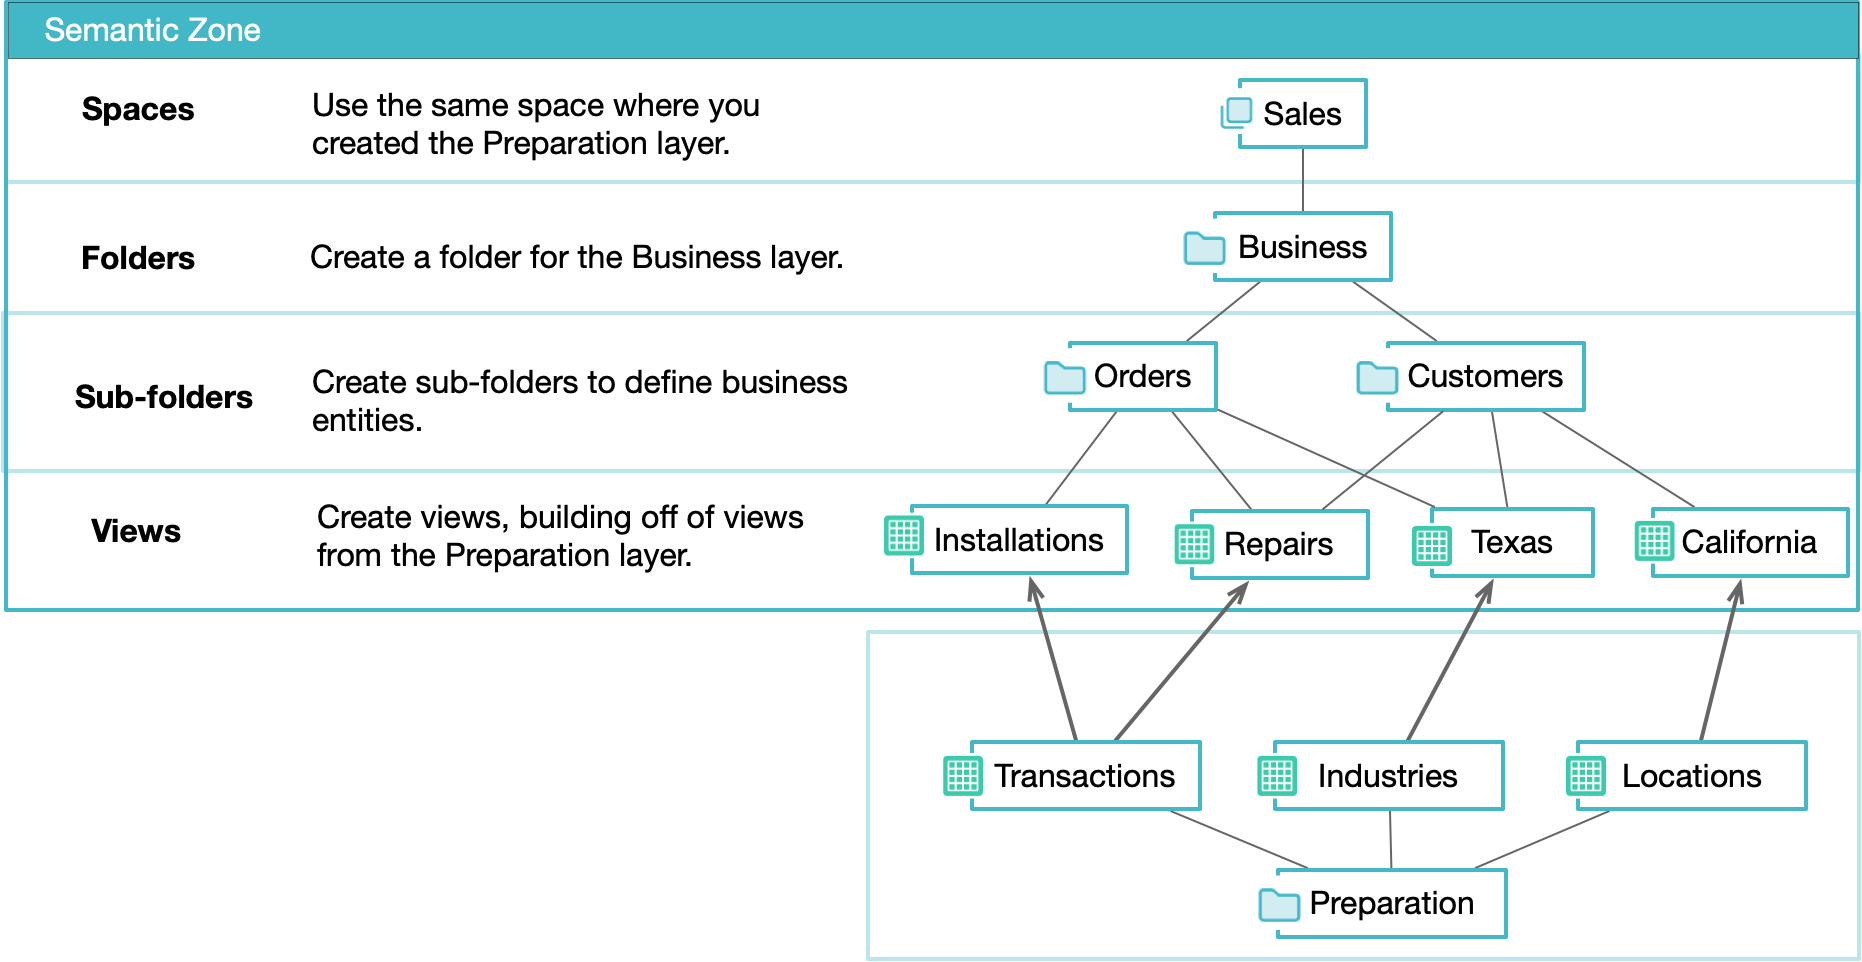
The Business layer provides a holistic view of all data across your Dremio space. It is the first layer where joins among and between sources should occur, and all views in this layer must be built by either:
-
Querying resources in the Preparation layer. Views in the Business layer should start with selecting all columns from the Preparation layer of that view. This is typically a 1:1 mapping between the Preparation layer and the Business layer.
-
Querying other resources in the same Business layer. When joining two views together, they should be joined from the Business layer representation of that view, not the Preparation layer. This allows all changes made in the Business layer to propagate to all joins.
Use your list of common terms to describe the key business entities in your organization, such as a customer, product, or an order. Typically, a data modeler works with business experts and data providers to define the views that represent the business entities.
You can create many sub-layers inside the Business layer, each one consisting of views for different subject areas or verticals. These views are reusable components that can and should be shared across business lines. Typically, views do not filter rows or columns in the Business layer -- that is deferred to the Application layer. See the diagram below for an example of the Business layer:

Using this layer, you can improve productivity for analytics initiatives and minimize the risk of duplicative efforts in your organization by:
- reducing the cost of service delivery to lines of business
- providing a self service model for data engineers to quickly provision datasets
- enabling data consumers to quickly put those datasets to use and share with others
Use the Application Layer to Arrange Datasets for Consumption
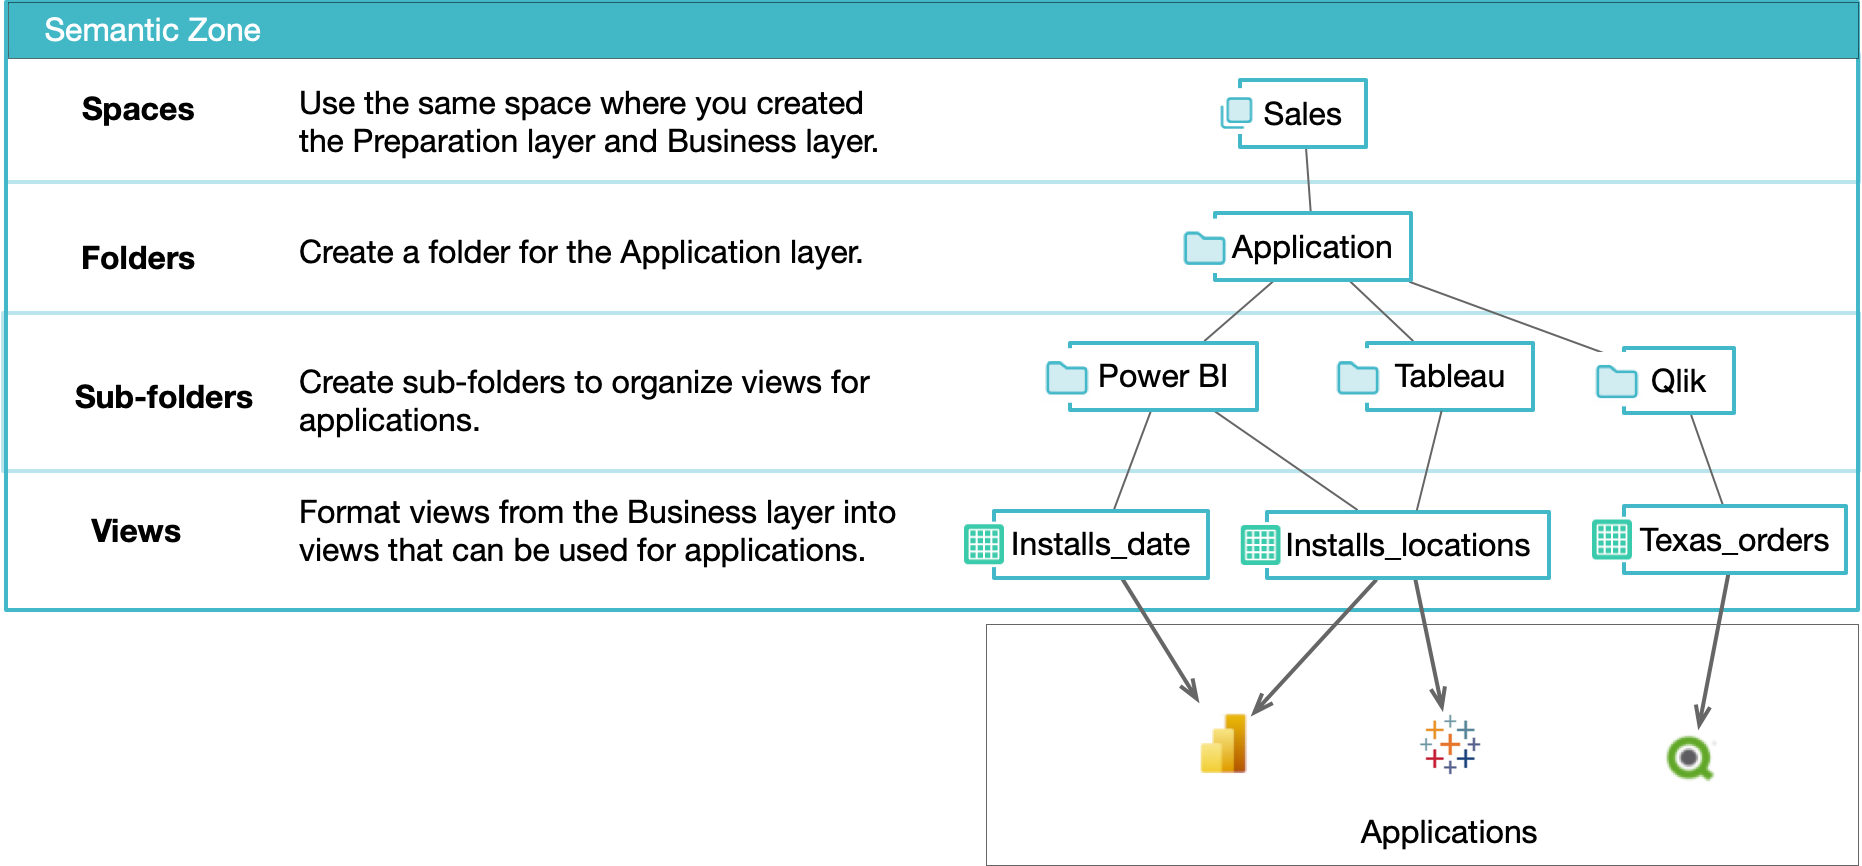
After creating views in the Business layer that describe key business entities, you can then format those views in the Application layer for the needs of individual data consumers, organizational departments, etc. Typically, data consumers, such as analysts or data scientists, leverage the views from the Business layer and work directly in the Application layer to create and modify views that are used in their own dashboards. See diagram below for an example of the Application layer:

Alternatively, if data consumers do not have direct access to the Dremio console, a designated developer with access to the Application layer needs to create and alter views on behalf of the data consumers via some formal change process. For change management, a developer would work with an Application SME to map the views in this layer.
You can create many sub-layers inside the Application layer to organize the resources being exposed by Dremio into subject areas or verticals. Ultimately, applications only have visibility into Application layer resources; they will not be exposed to any lower level views.
If the Application layer is providing for self-service access to Dremio’s semantic layer, you should expose, at a minimum, all Business layer views in the Application layer. Even if the view is SELECT * from BUSINESS_VIEW, that provides logical separation for security and performance improvements.
If the Application layer is not for self-service but for particular applications, the views in the Application layer should be built on top of those self-service views in the Application layer and adding any application specific logic. Application logic should be row filters, as needed by the application. Columns can be left as-is, and then the list of columns selected by the application will be reduced in the SQL query.
Use Role-Based Access Control
The access for each folder can be managed and regulated by roles. Roles are used to organize privileges at scale rather than managing privileges for each individual user. You can create roles to manage privileges for users with different job functions in your organization, such as Analyst and Security_Admin roles. Users who are members of a role gain all of the privileges granted to the role.
Access control protects the integrity of your data and simplifies the data architecture available to users based on their roles and responsibilities within your organization. Effective controls allow users to access data that is central to their work without regard for the complexities of where and how the data is physically stored and organized.
Development Environments
For a development environment, we recommend granting privileges on each folder according to roles, because the folders are at a higher hierarchical level than views. Then work your way down through the folder to grant privileges to any subfolders and views that are different from the folder privileges.
To grant privileges for each layer folder, you can grant SELECT or ALTER privileges. SELECT allows users to view data on all folders, tables, and views in the layer folder, whereas ALTER enables users to edit the table or view definitions or settings of all tables and views in the layer folder. See the table below for recommended privileges based on the following roles:
| Folder | Data Engineer/SME | Semantic Data Modeler | Report Developer/Analyst/Data Scientist |
|---|---|---|---|
| Application | SELECT or ALTER | SELECT or ALTER | ALTER |
| Business | SELECT or ALTER | ALTER | SELECT |
| Preparation | ALTER | SELECT | None |
In this development environment, the report developer has SELECT and ALTER privileges for the Application folder and SELECT privileges for the Business folder. This enables the report developer to edit only within the Application layer but still see the views and folders in the Business layer.
Note that some roles have multiple possible permissions defined as SELECT or ALTER. This is because we may want to give nested subfolders different privileges depending on who owns the folder (e.g., the owner will be able to edit the views in a folder but other roles can only see the views in the folder).
QA/Test and Production Environments
For a QA\test or production environment in Dremio, we recommend that roles only be granted SELECT privileges. Use only SELECT privileges as needed, because changes should only be permitted in a development environment or development space. See the table below for recommended privileges based on the following roles:
| Folder | Data Engineer/SME | Semantic Data Modeler | Report Developer/Analyst/Data Scientist |
|---|---|---|---|
| Application | SELECT | SELECT | SELECT |
| Business | SELECT | SELECT | SELECT |
| Preparation | SELECT | SELECT | None |
In this production environment, the report developer has only SELECT privileges for the Application folder and Business folder but no privileges for the Preparation folder. Controlling access of the report developer enables them access to views and folders that are central to their work without the complexity of how the data is physically stored and organized.
Build Upon Views
Build upon views in the semantic layer by adding wikis and labels to enhance discoverability and understanding of your data across your organization. You can use the wiki to provide a description of the dataset or content that helps users get started with the data, such as examples, usage notes, or points of contact for questions or issues. Adding labels will help users identify the dataset.
Labeling views and adding wiki content helps make the semantic layer more approachable as a self-service by enabling users to quickly find the resources they are interested in using either as-is or as the basis for a new view. A user will be curious to know what resources are already available to them, so being able to search for keywords or search on table or column names can be very useful. In addition, users will want to understand in more detail the meaning of a set of views in a particular space or folder, what their purpose is, what data they expose etc., which is where wiki entries are especially useful.
User Experience
According to Dremio’s security recommendations above, data consumers such as report developers, analysts, and data scientists do not have visibility into views in the Preparation layer, and the views in the Preparation layer are typically one-to-one mapping with their table equivalents anyway. Therefore, there is little value to data consumers in adding labels and wiki entries to the Preparation layer resources. However, data engineers and semantic data modelers will likely find labels and wiki content useful in the Preparation layer.
By contrast, the Business layer really is at the heart of the self-service semantic layer as a whole, and therefore, labels and wiki entries should be used extensively in this layer. It will not be the responsibility of data consumers to add labels and wiki content in this layer, because that will be done by the semantic data modelers with assistance from data engineers. Data consumers will spend a reasonable proportion of their time searching for relevant metadata in the Business layer and subsequently using the results of their findings to create new views or alter existing views in the Application layer. Data consumers should add labels and wiki entries themselves to views and folders they create in the Application layer.
Below you can see the recommended responsibilities based on folder privileges for the following roles:
| Folder | Data Engineer/SME | Semantic Data Modeler | Report Developer/Analyst/Data Scientist |
|---|---|---|---|
| Application | |||
| Business | |||
| Preparation |
Use Case Examples
Example 1
One set of data consumers might want to see “customer” views aggregate on field A, whereas a different set of data consumers might want to see the same “customer” views aggregate on field B.
If given the necessary access to do so, data consumers such as analysts or data scientists can work directly in the Application layer in the Dremio console to create and modify views for use in their own dashboards and they can leverage the views built inside the Business layer to help them achieve this. Joining multiple views from the Business layer to produce new views in the Application layer is a perfectly valid approach.
Example 2
The Business layer enables an additional layer of abstraction over the raw data sources that facilitate important use cases, including data migration. Common data migrations are from an on-premise data lake to a cloud data lake and from a non-data lake source, such as a data warehouse, to an on-premise or cloud data lake.
Data consumers can be exposed to views that give them the data they need initially from the original source, while in the background, the data is being migrated into the new source. Then, once the data has been migrated successfully, the view is updated to select its data from the new source and the business consumer will continue to receive the data they expect without impact. In this use case, the business consumer will always query the same views throughout the entire migration process. The only thing that changes in the Dremio console is where that view gets its data. This also applies to any applications that use this data.
Leverage Tags to Enhance Searchability
Create and assign tags to tables and views to enhance the discoverability of data across your organization. You can search for sets of tables and views based on a tag, or you can click on a tag to start a search based on that specific tag. The tagging functionality enables you to group related objects with the same tag. Objects can also have multiple tags so they can belong to different logical groups.
Create Wiki Content to Embellish Datasets
Use Dremio’s wiki functionality to add a description to a space, source, folder, table, or view. This will enhance the understanding of the data inside your organization. The wiki is extremely useful to provide more context around the dataset, such as descriptions for each column, or content that helps users get started with the data (e.g., usage examples, usage notes, or points of contact for questions or issues).
The formatting language for wikis is a Github-flavored markdown and supported by a rich text editor.
Use Data Lineage to Understand Relationships Between Objects
Use Dremio’s data lineage graph to understand the parents or children of a specific dataset and to understand how datasets combine. You can trace the lineage all the way from a view back to the table(s) in its associated data sources. The entire structure of tables, column names, data types, how many times it’s been queries etc. is presented as you traverse the graph.